GUS. A brain for cities.Because "ask the spatial team" wasn’t a scalable answer.
GUS is our Geospatial Understanding System — the AI platform SilaCities deploys for governments, consultancies, developers and investors. Ask your city anything in plain language, and the answer comes back cited to its source. Underneath sit nine workspaces — from Chat to Map View — three engines and one shared map of the city, so every workspace tells the same story.
One platform for every question your city raises.
Each workspace is built for a different kind of work. Inside, an agent picks the path and calls on 90+ specialist tools — all reading the same enriched dataset on the same neighbourhood grid, so every answer agrees with every other.
GUS Chat
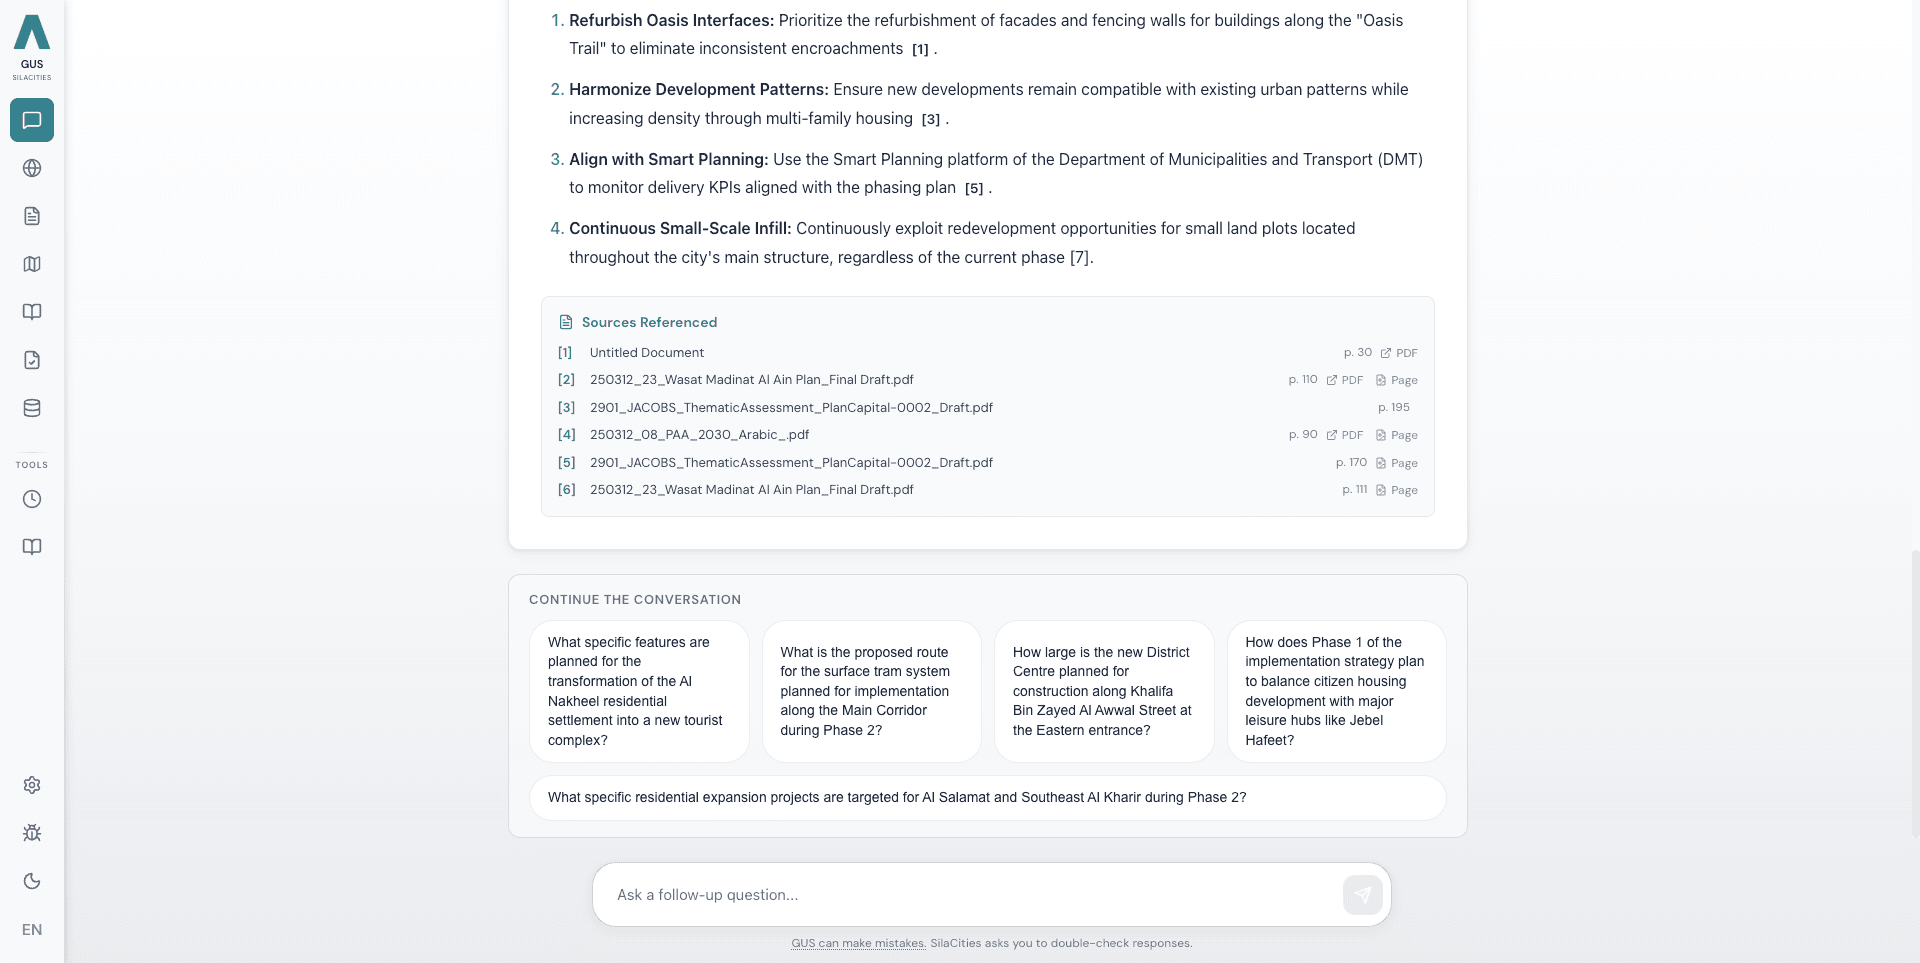
Ask your city anything, in any language. The answer reads across satisfaction, demographics, economics, activity, your own documents and the spatial relationships between them. Every claim carries an inline citation you can click open.
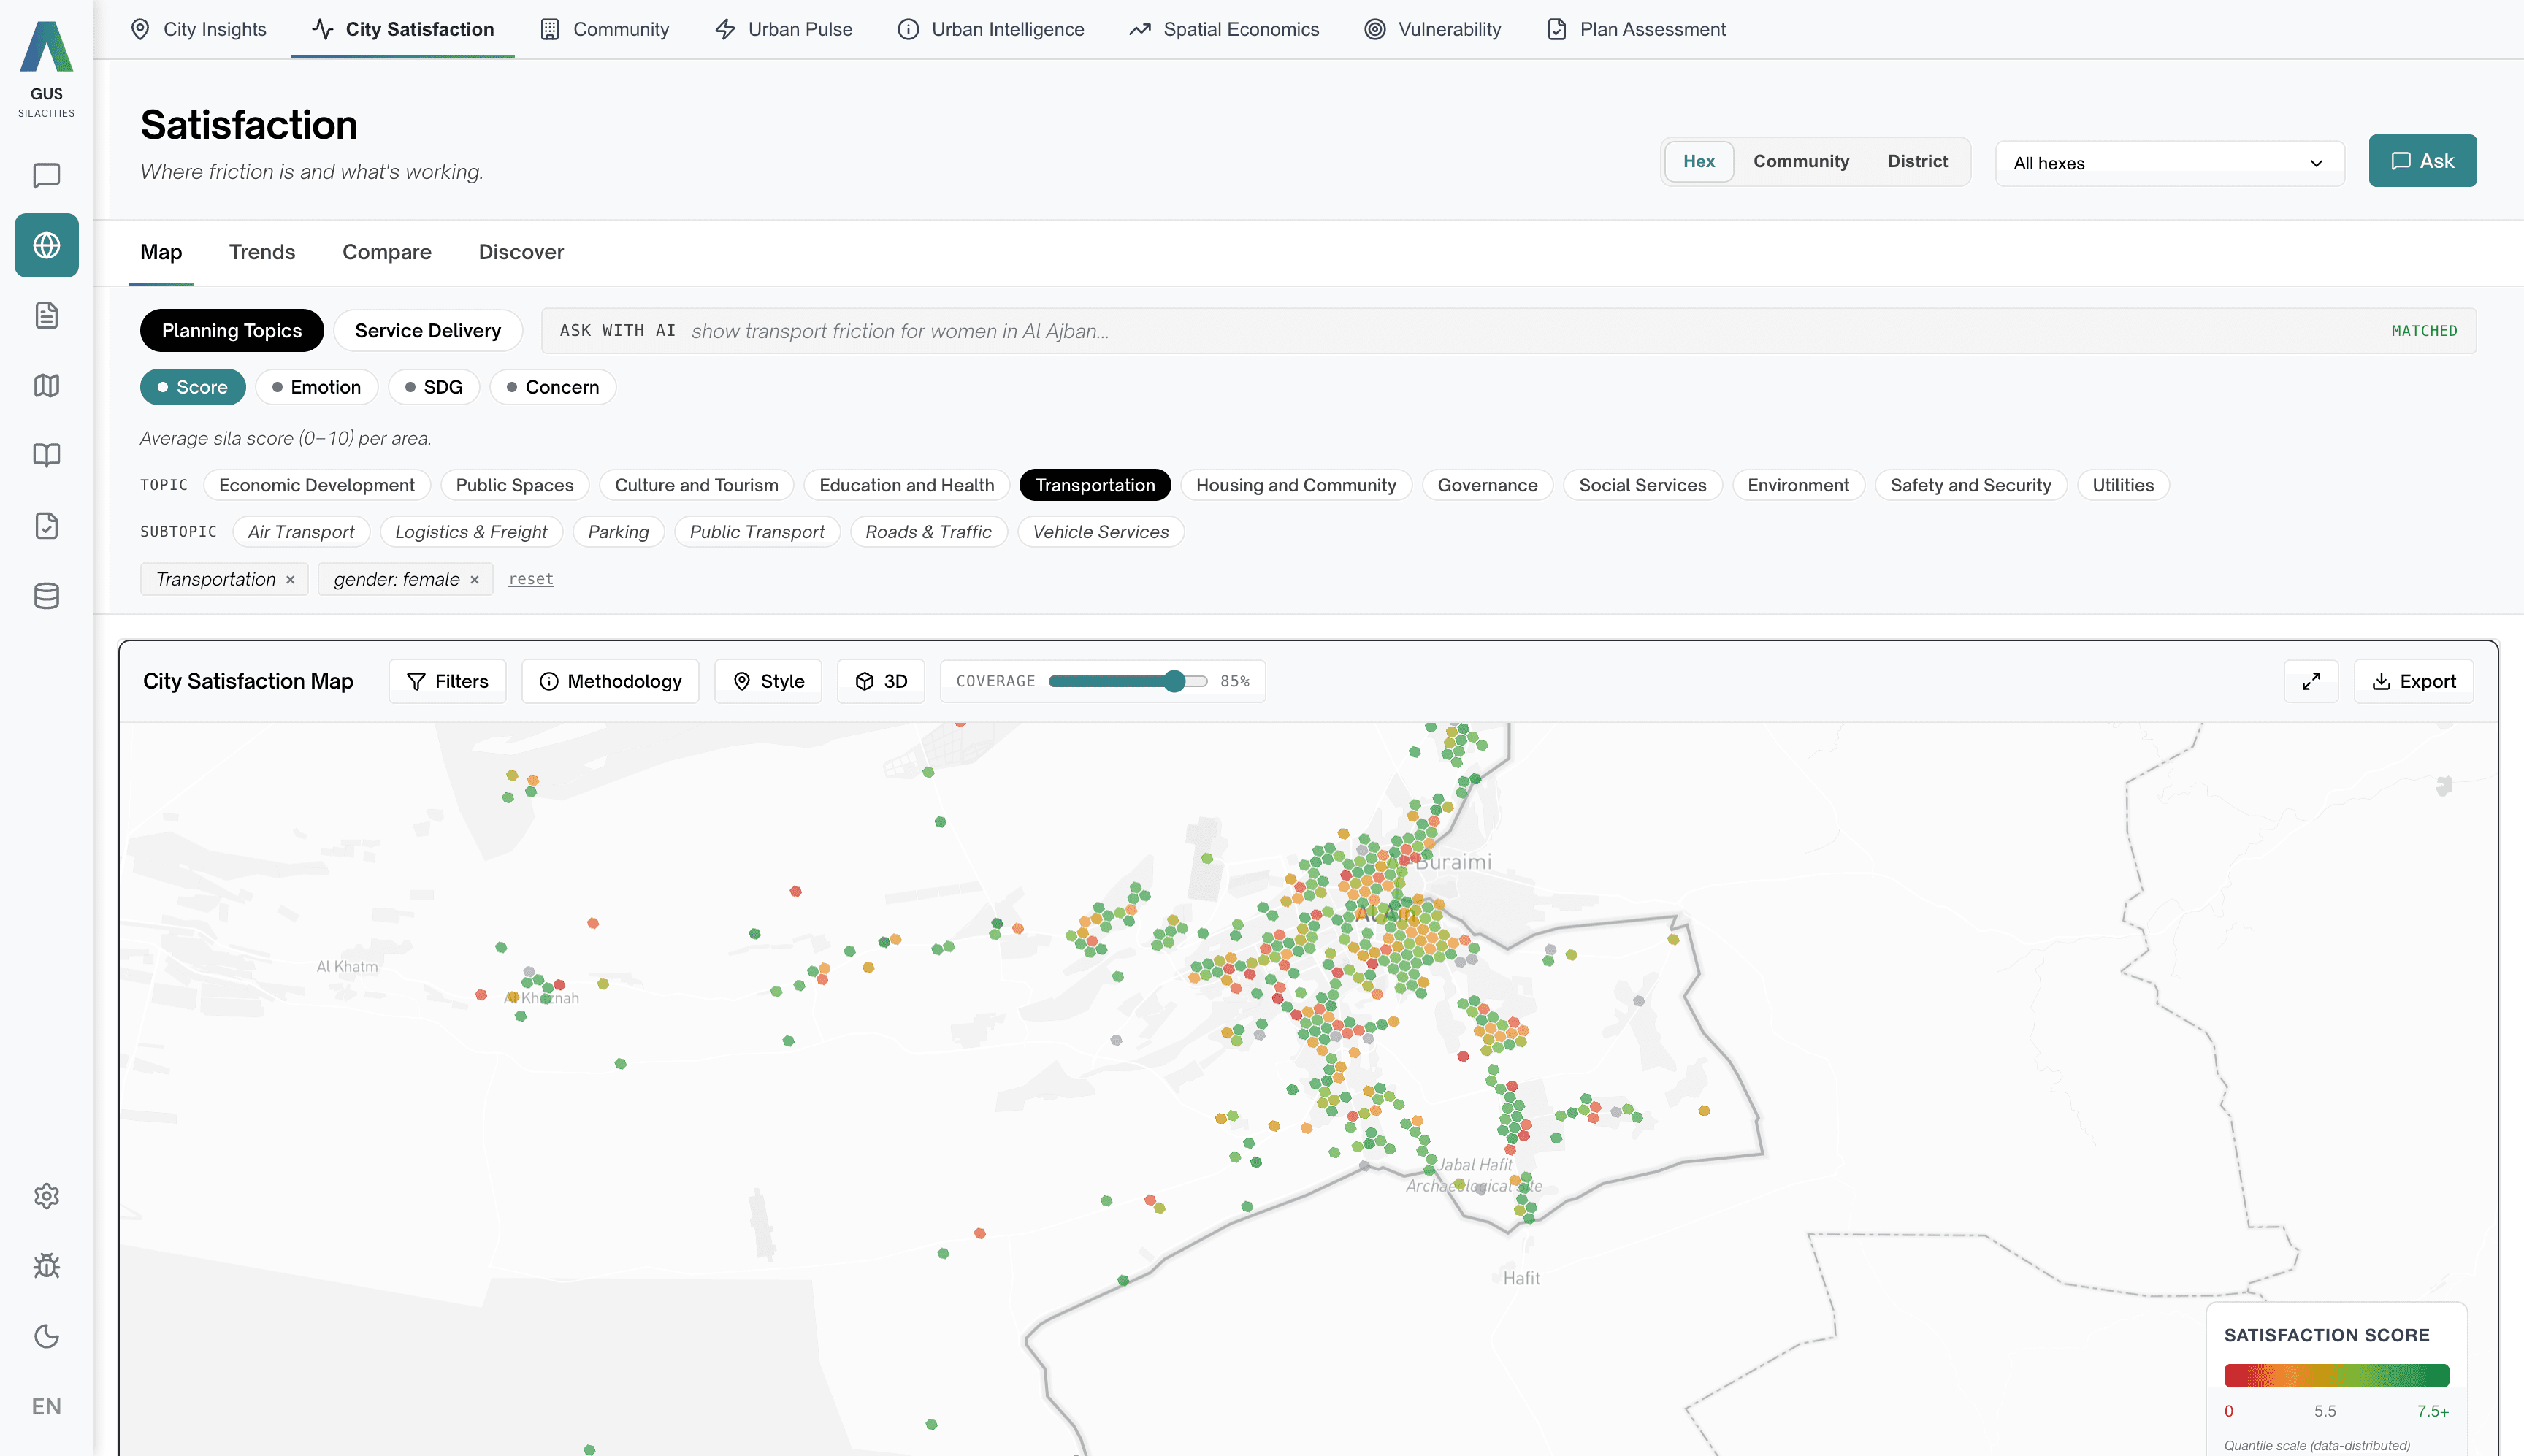
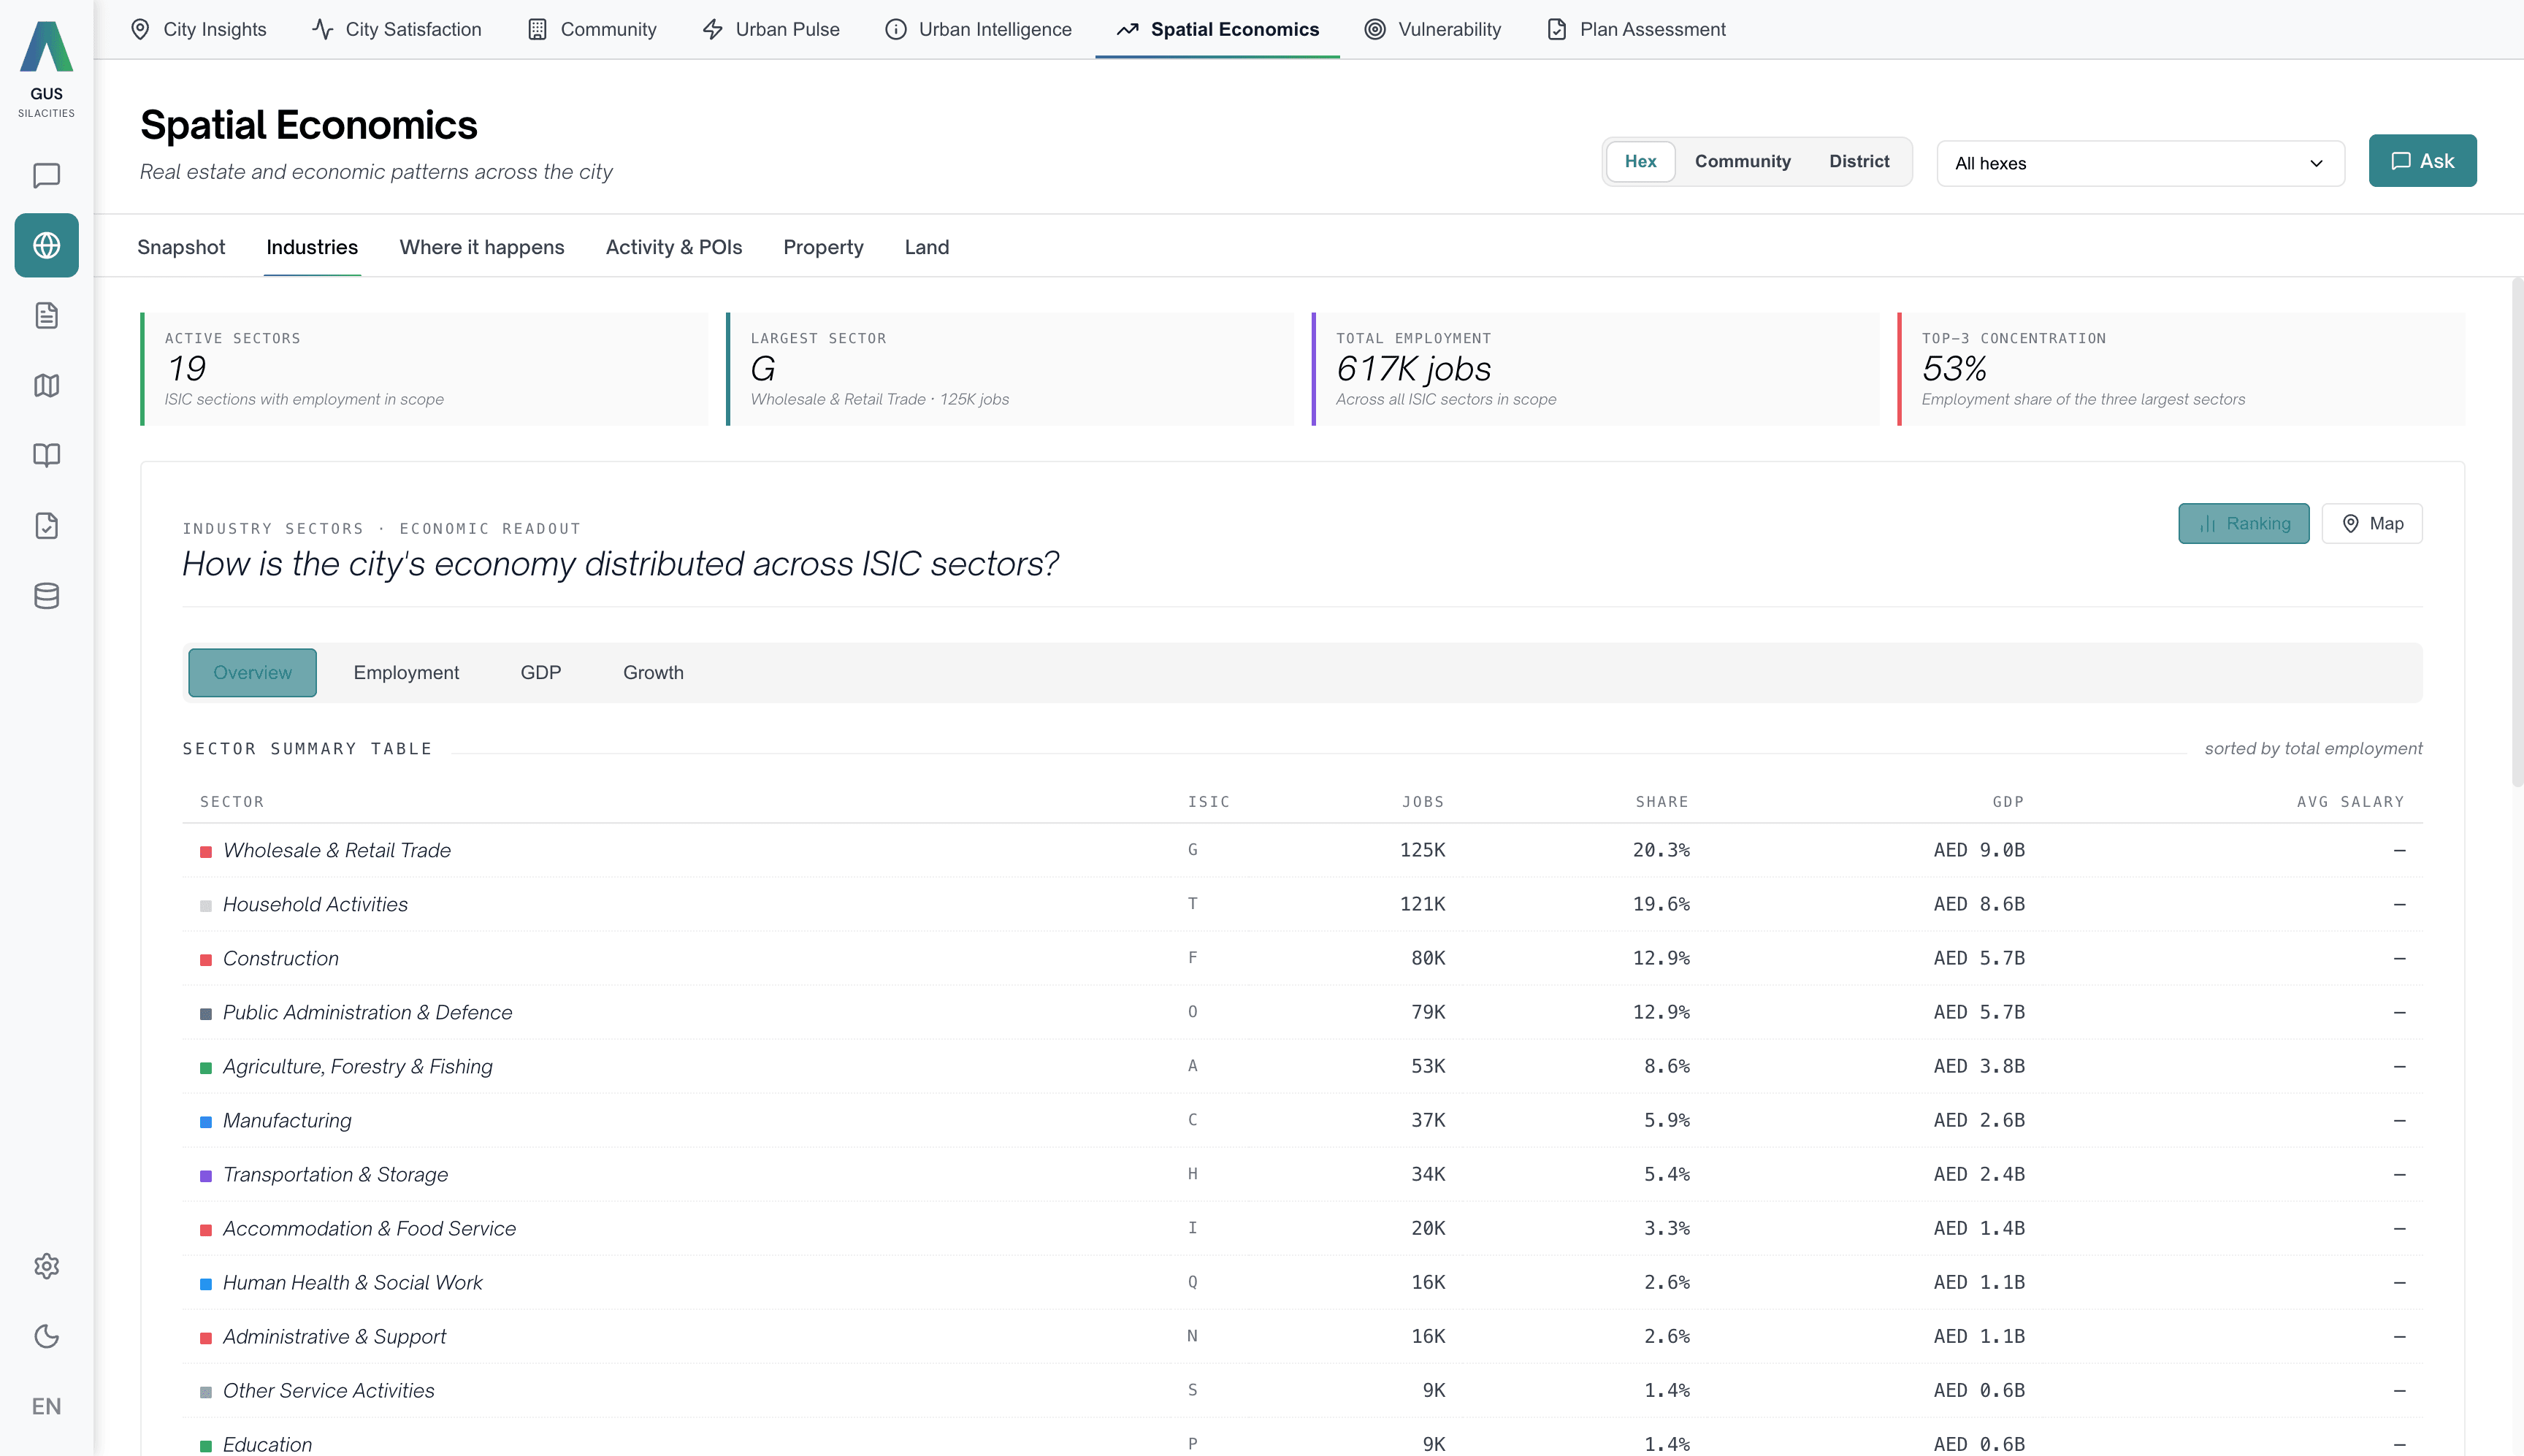
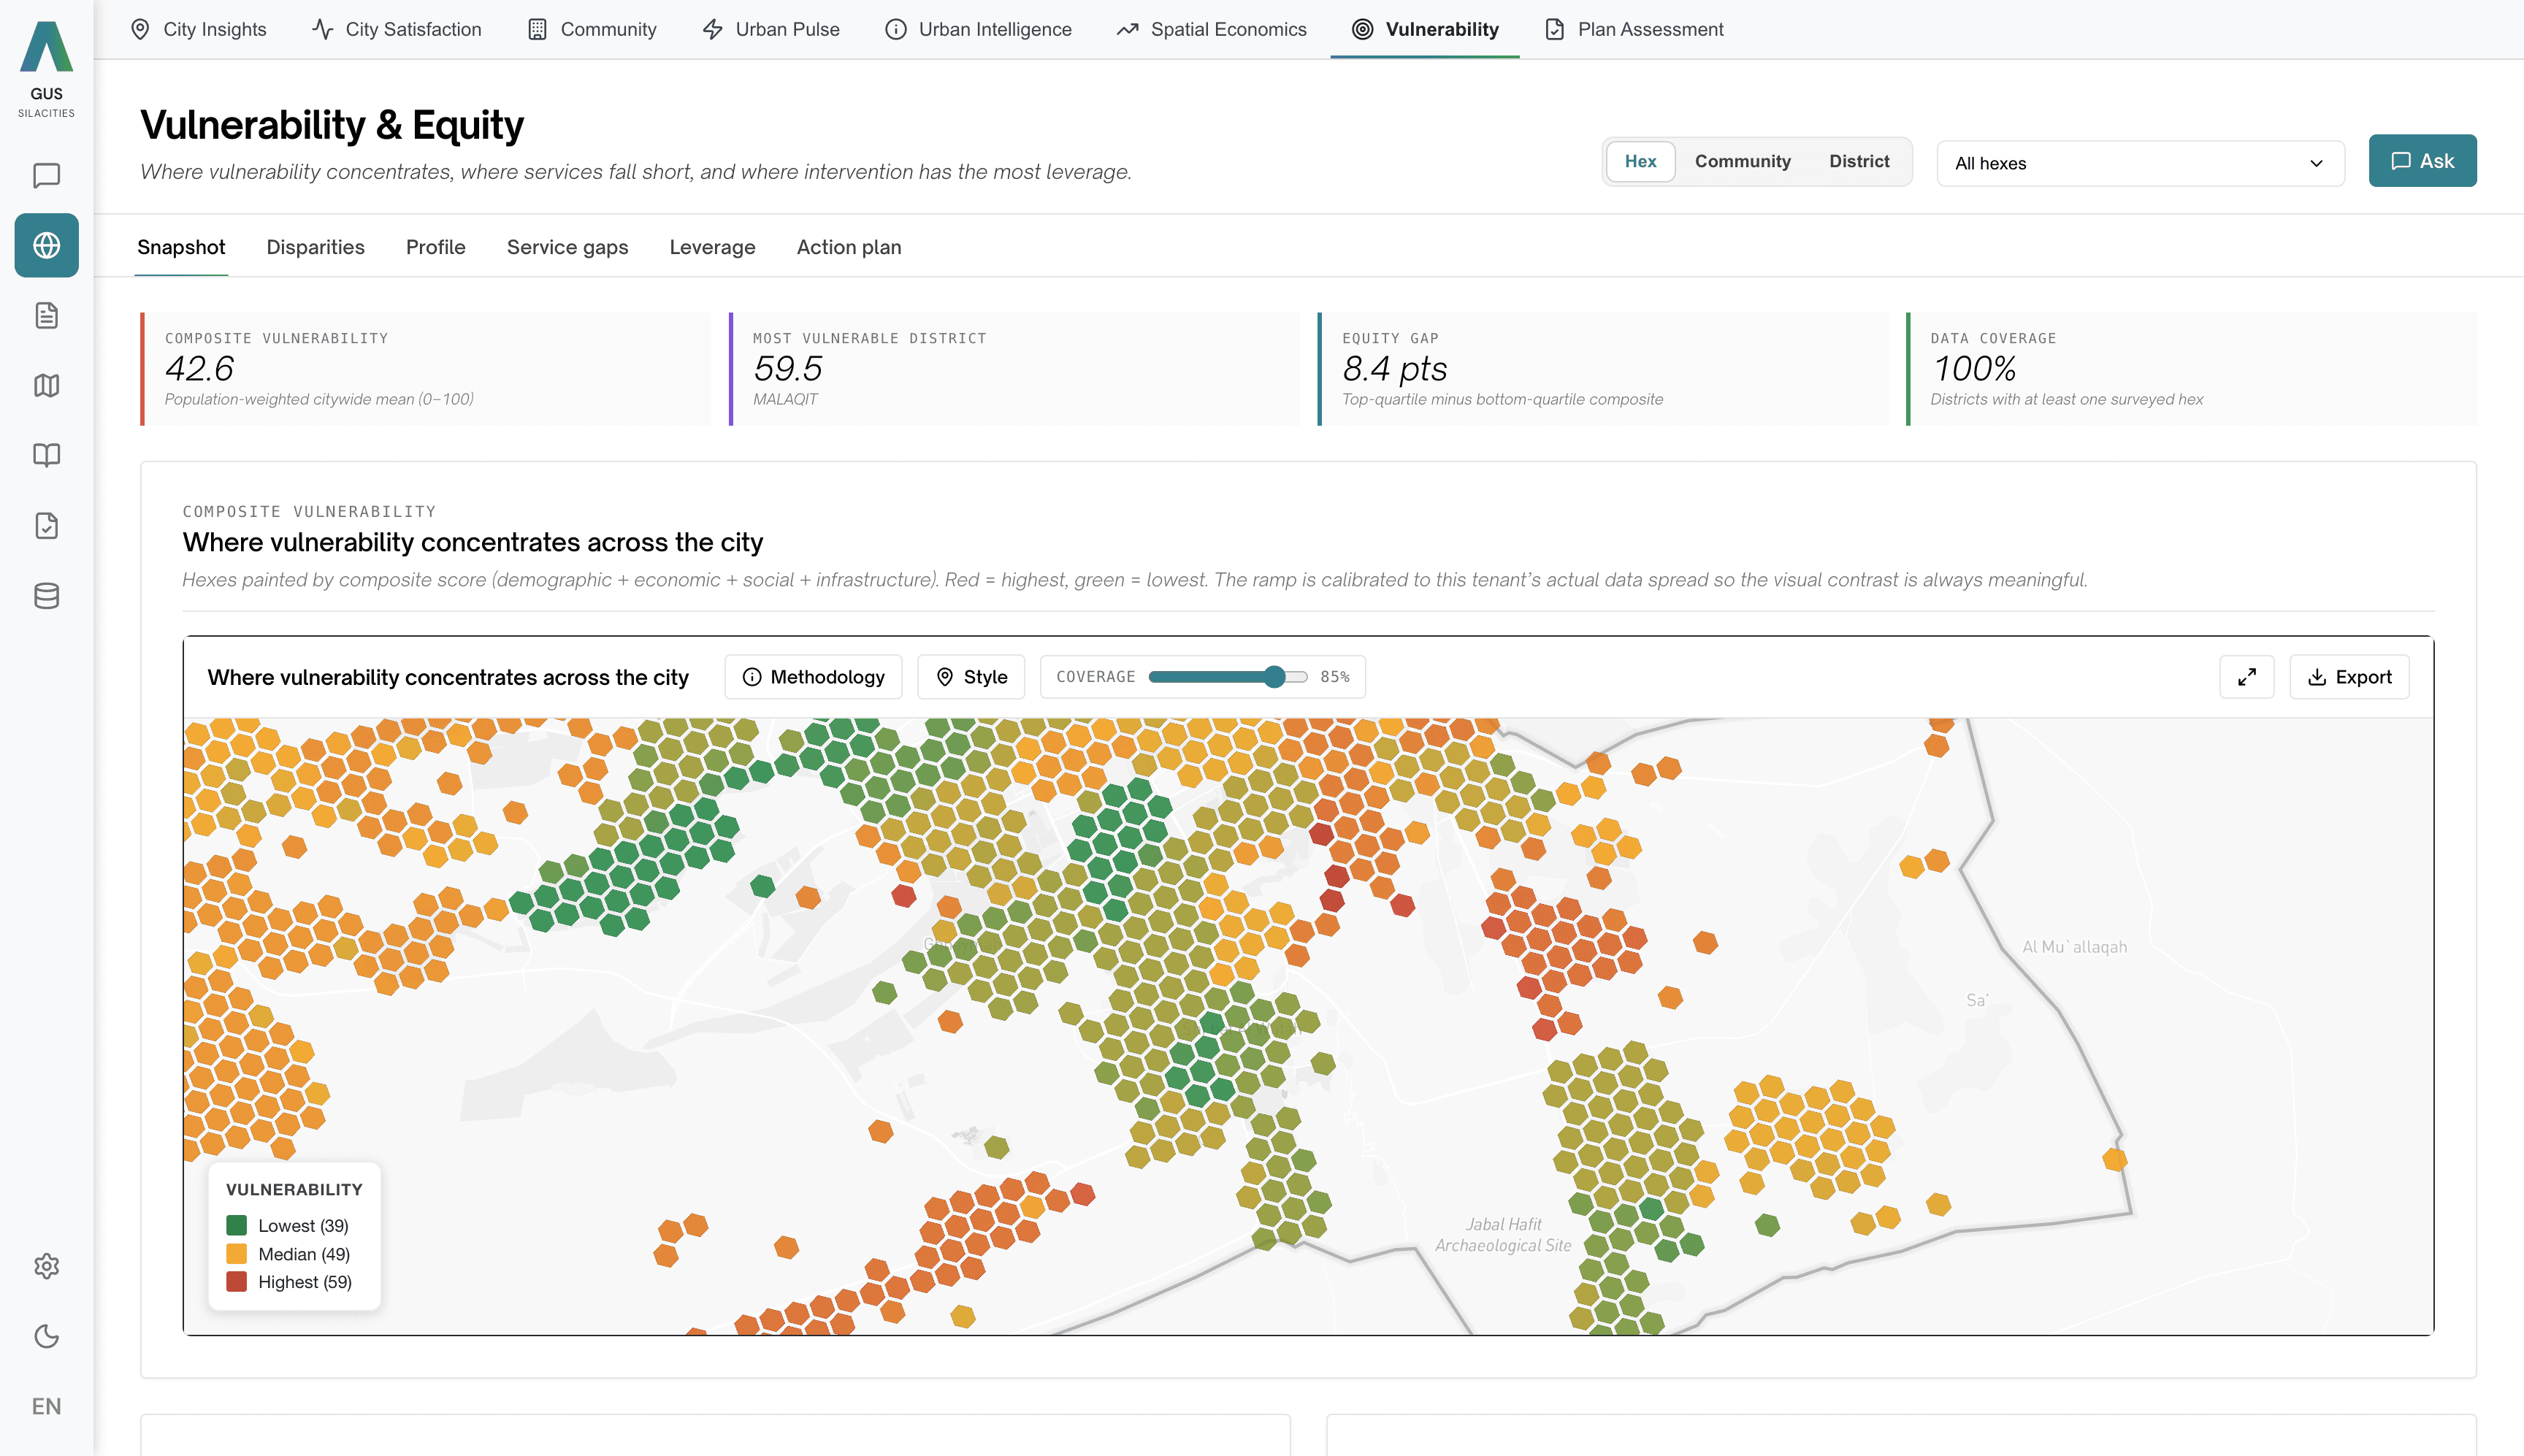
Socio-Economic Atlas
Seven lenses on your city. Synthesis, satisfaction, community, pulse, urban intelligence, spatial economics, vulnerability, plus an AI assistant that follows you across every one. All on the same neighbourhood grid.
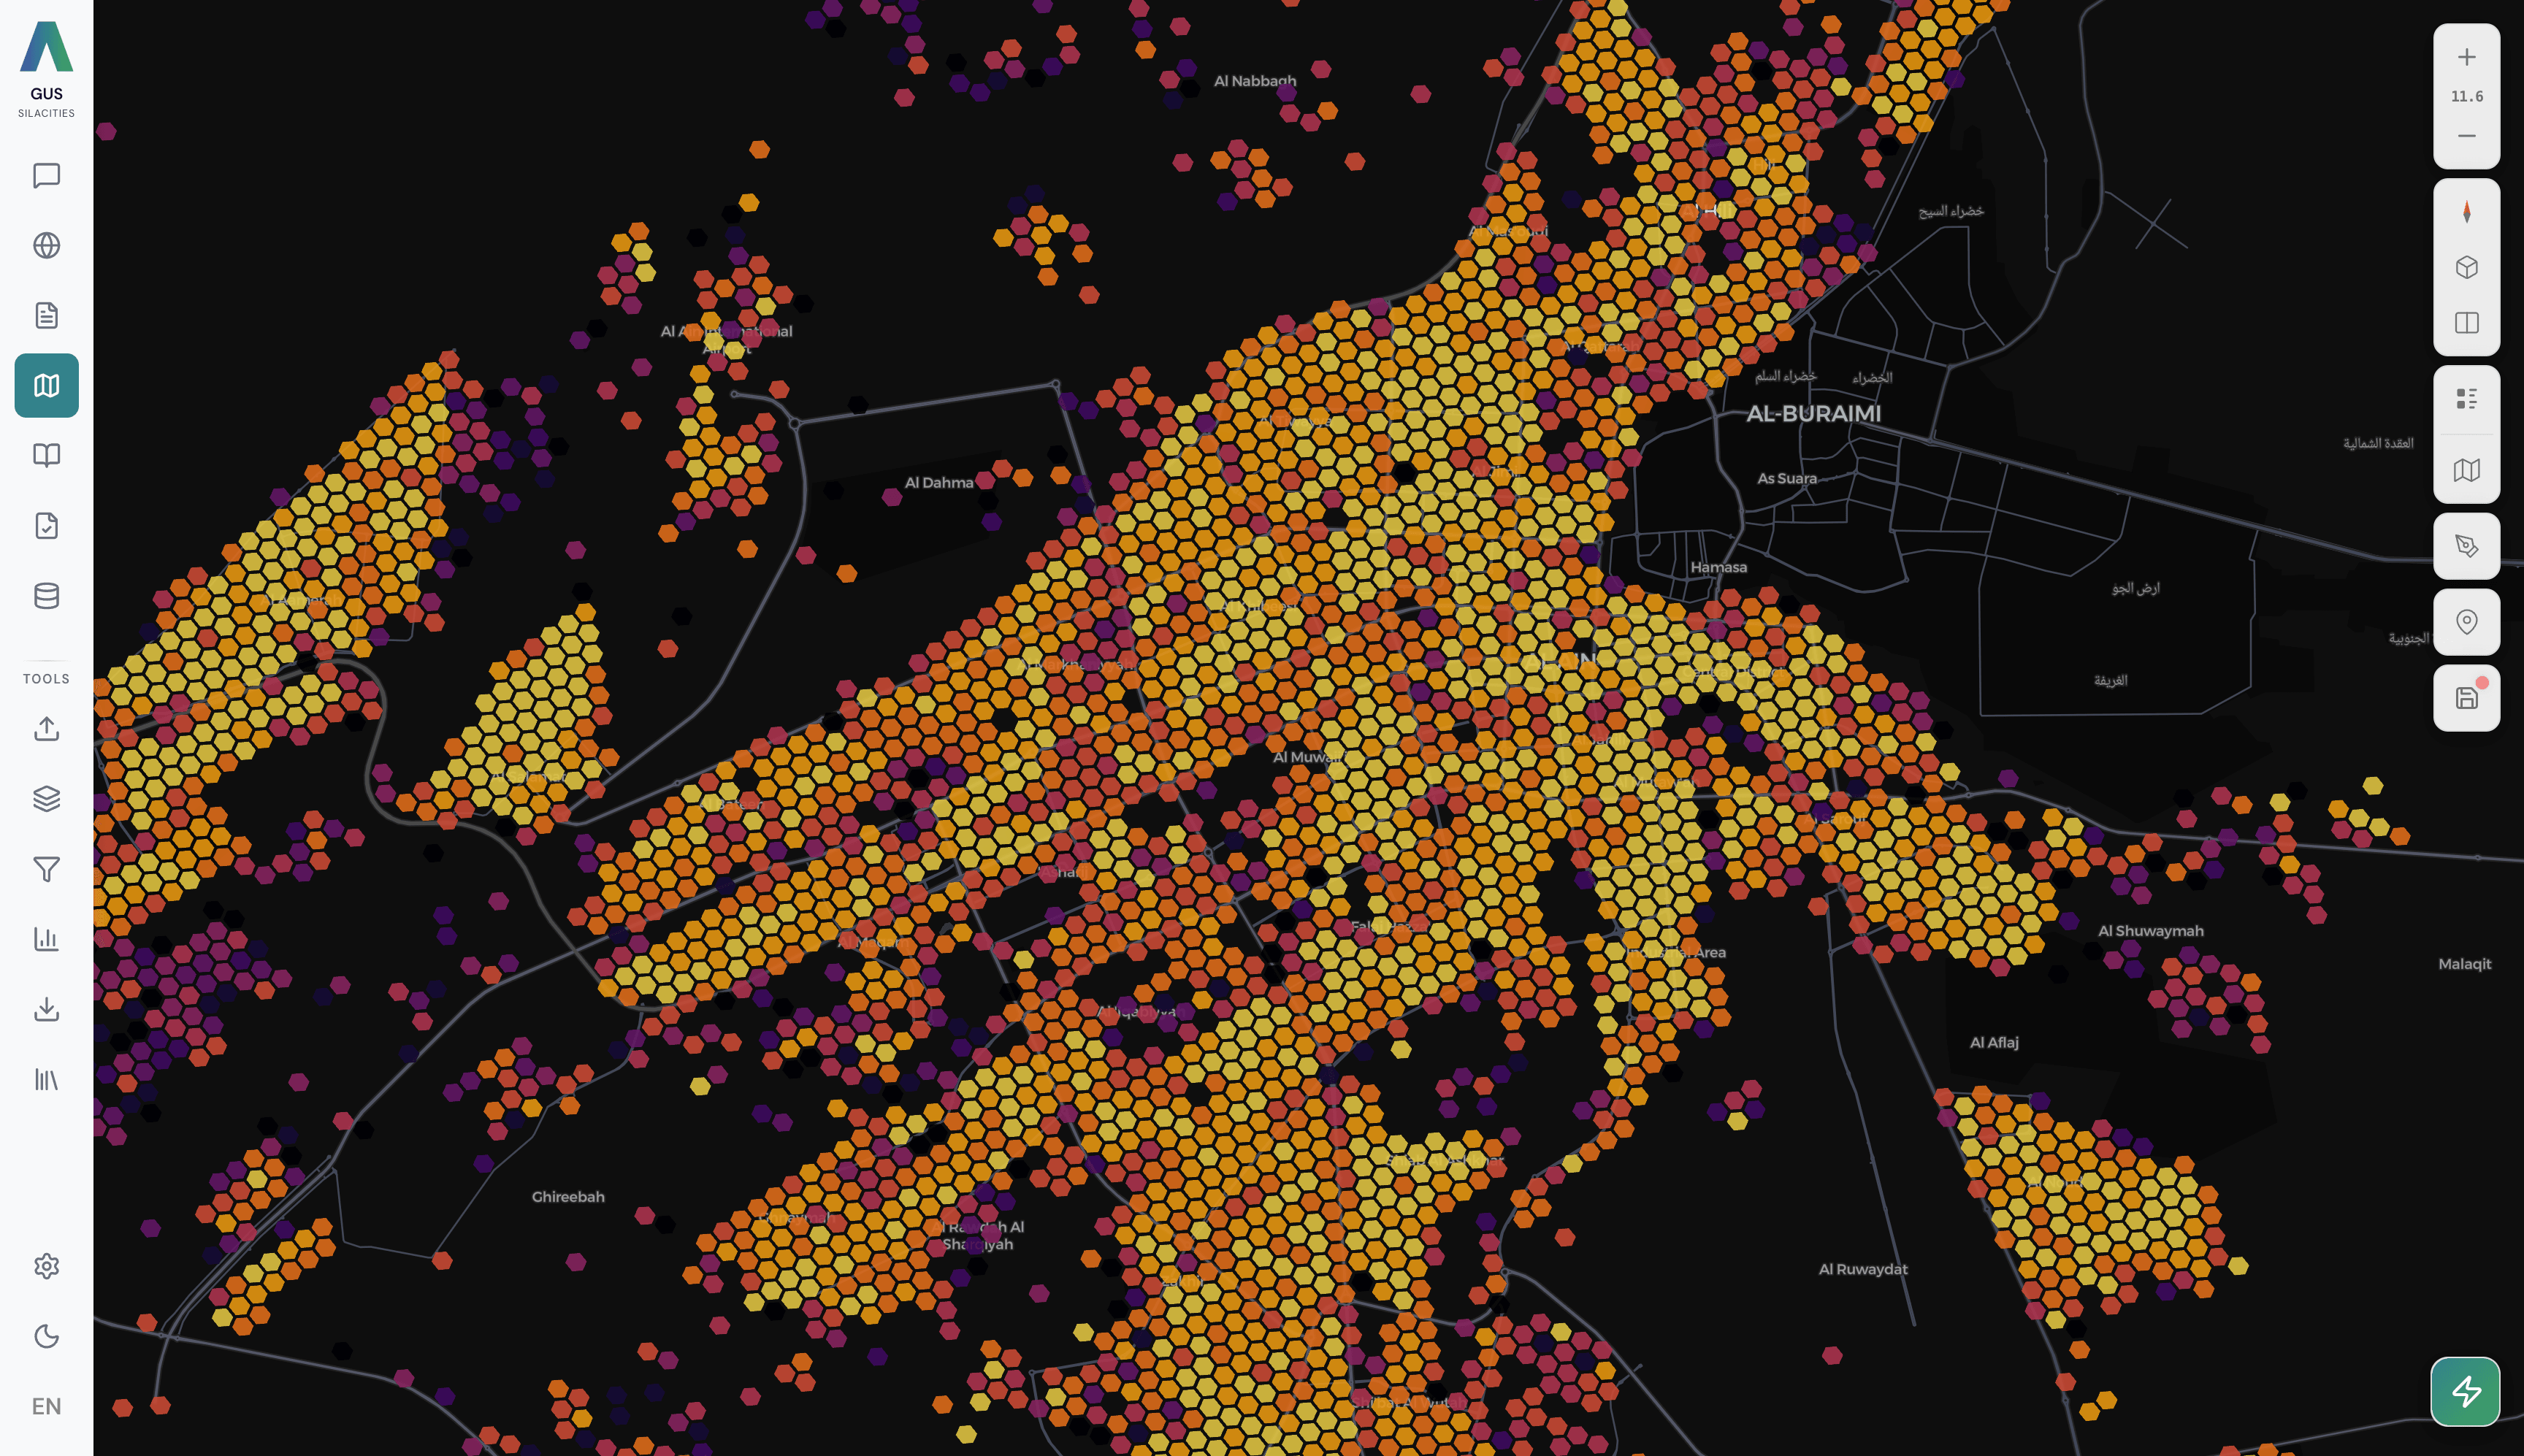
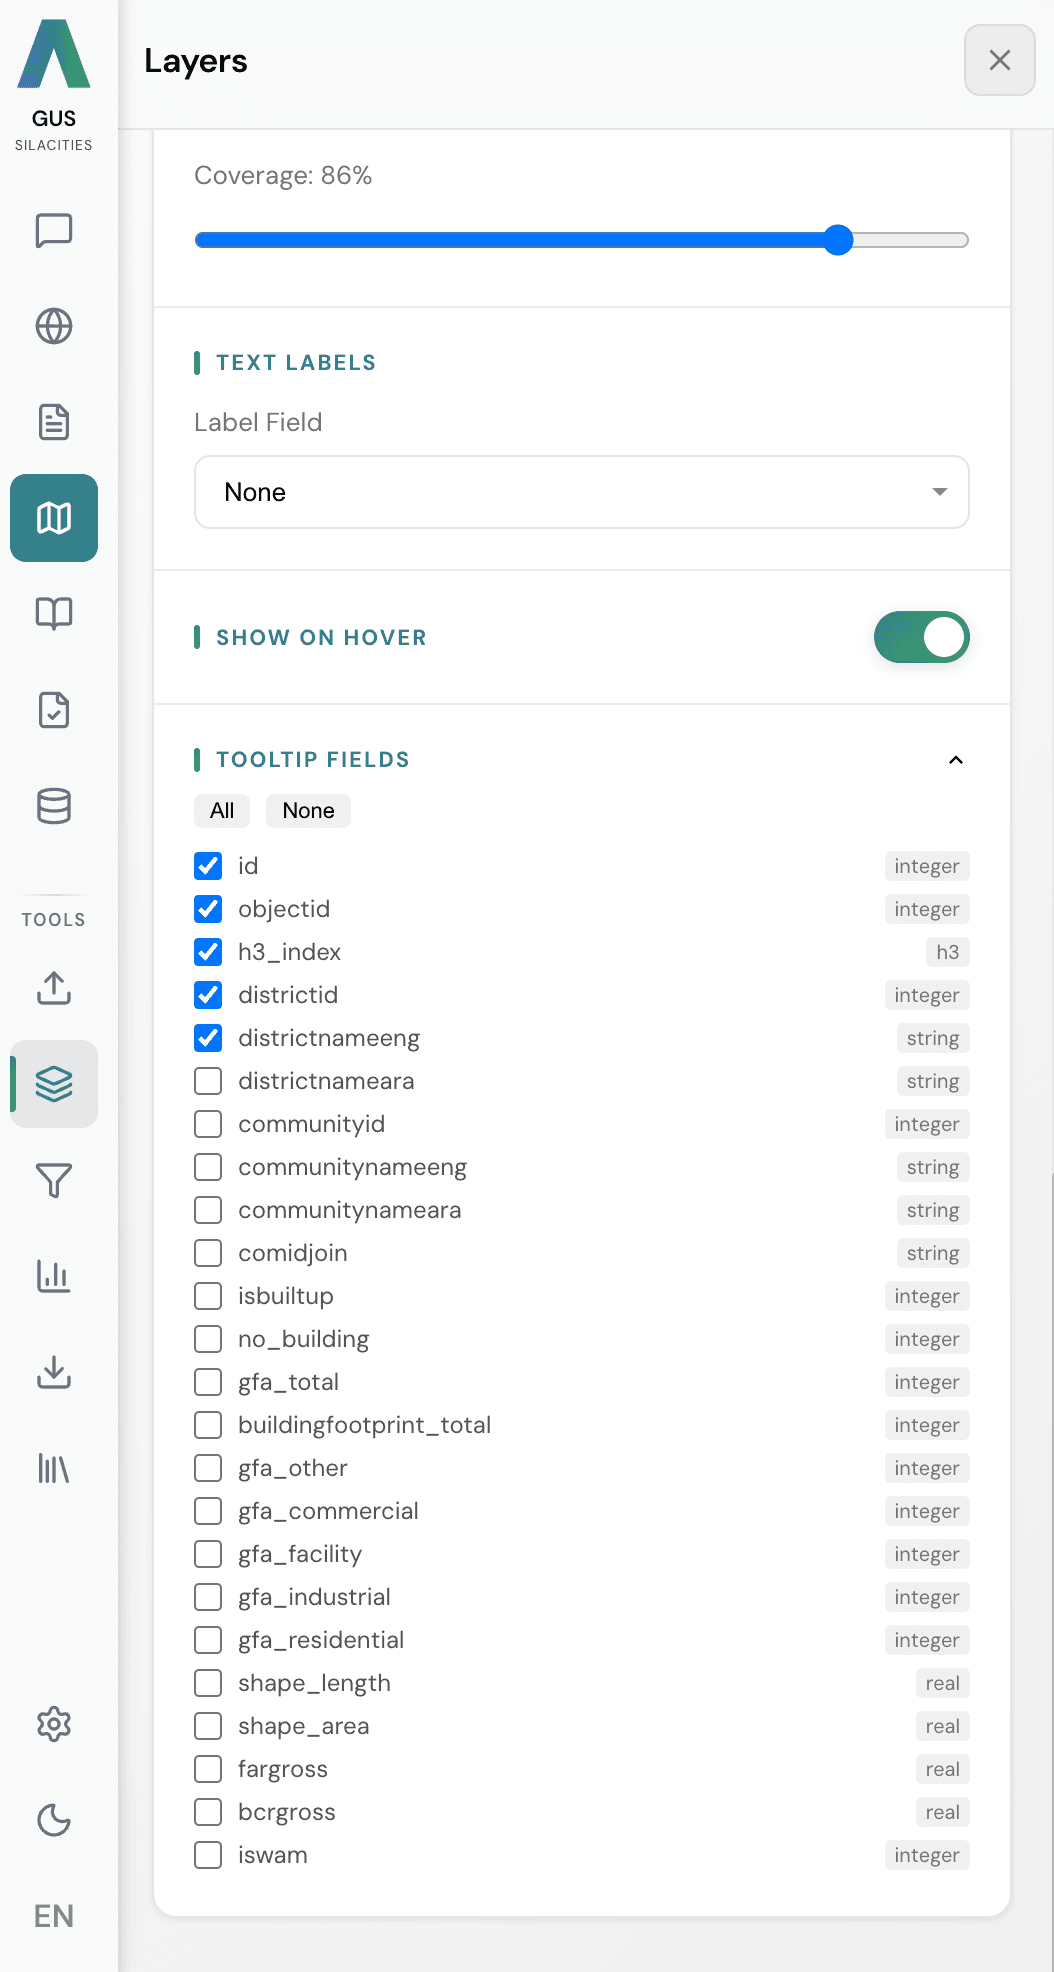
Map View
The full GIS workspace, for the days you want every lever. Load any dataset, build layers by hand, run operations, export. An AI assistant runs twenty statistical and spatial tools on request, and clicks on its charts filter the map live. Save any session, share it, come back to it.
GUS Consult
Pick a report type, pick which experts weigh in. A full brief assembles in minutes, ready to export to PDF, Word or PowerPoint. Keep every brief in one library.
Data Management
Bring your own data in. Spatial files, tabular data, documents, imagery. Drop them in, tag them, and they are ready for every tool to use.
GUS Fieldnotes
Tell a story with the map. Write each scene by hand or generate the whole sequence from a topic. The map flies between locations as readers scroll. Publish as a scroll, a slideshow, a PDF, or a public link in one click.
GUS SQUID
Our Site Qualification and Urban Investment Discovery tool. Click a location, pick a business type, get a 0 to 100 suitability score backed by four signals: population, activity, competitors, resident satisfaction. The brief writes itself.
GUS DAT
Our Development Assessment Tool. Pin a plot, pull its regulations, run a five-stage assessment from site to compliance to impact, and ship a Development Control Report your committee can sign. Two operating modes, one audit trail.
GUS Plan Assessment
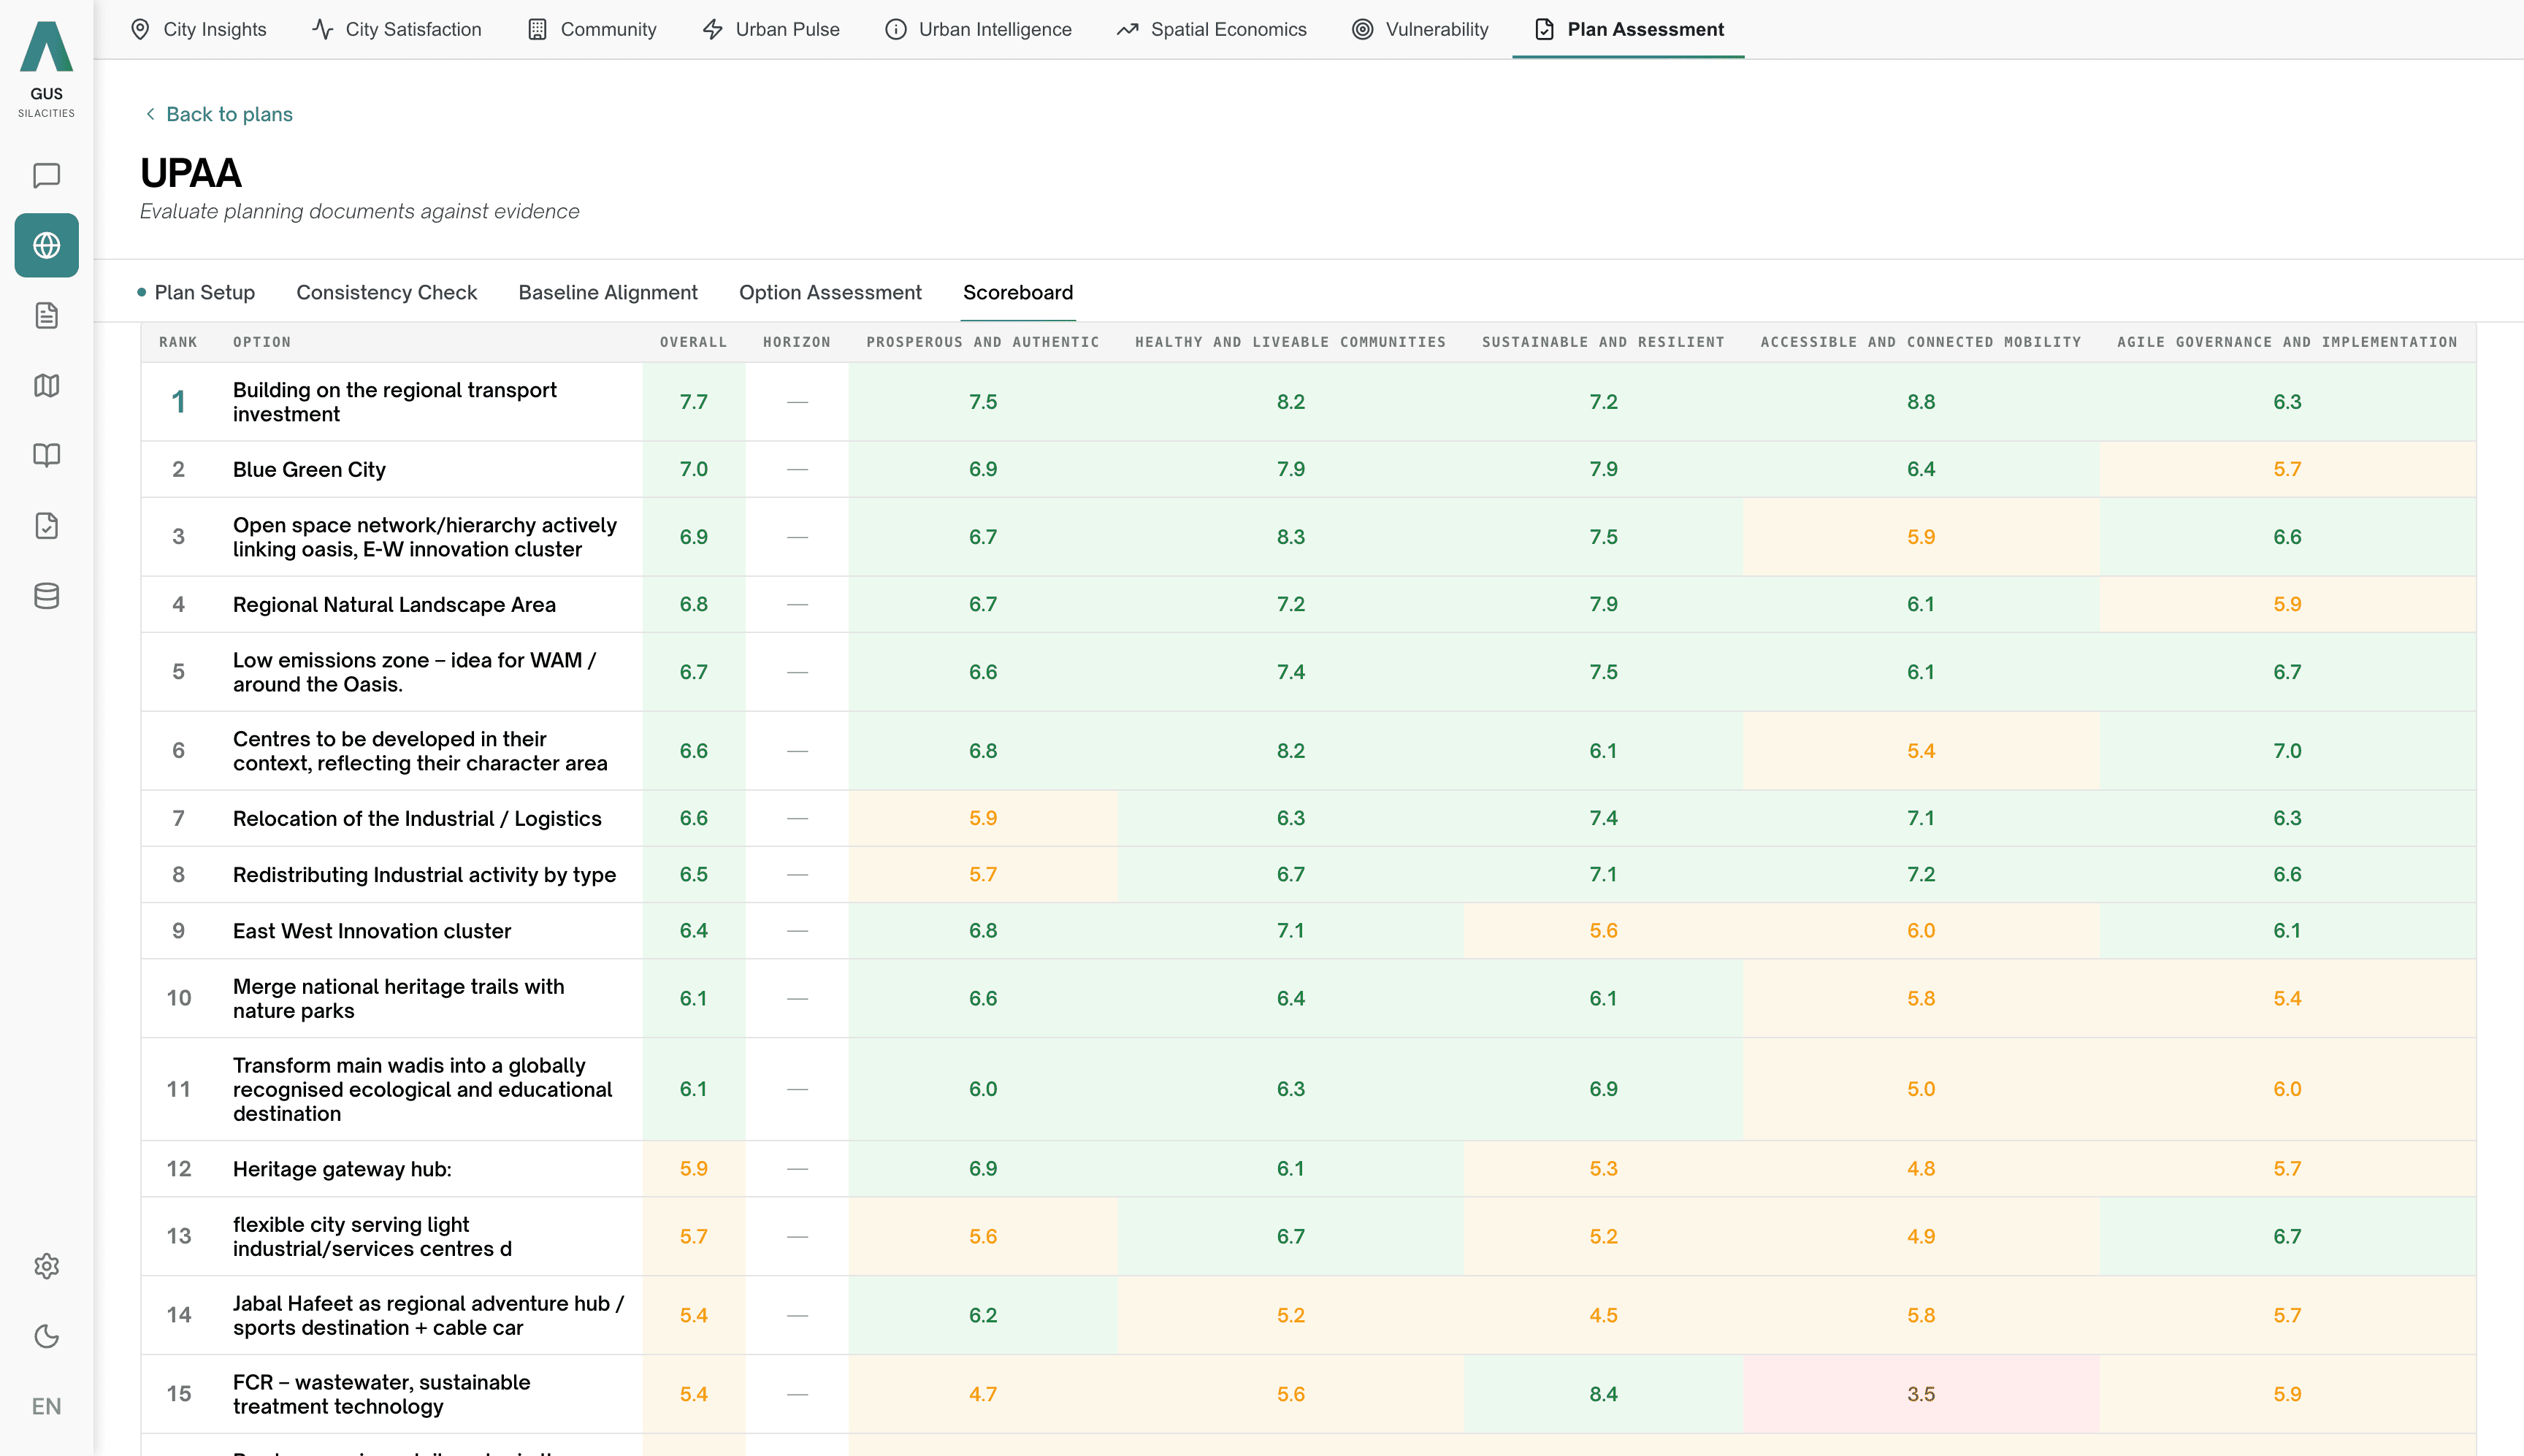
Our strategic plan evaluation tool. Upload a development plan, score it across land, people, movement and policy fit, and export a cited brief with AI-drafted policy recommendations. Multi-criteria suitability for the teams that have to approve a city’s next move.
Every claim, back to a row.
The data substrate behind every GUS answer. Six analytical areas mapped to twelve canonical topics, fused on one neighbourhood grid, in any language your team works in.
Three engines. One spatial truth.
Underneath the platform sit three proprietary engines. Each reads a different slice of the city. All three are fused against the same neighbourhood grid, so findings always agree — and the agents reach across all three, calling 90+ tools to build each answer. This is the part competitors cannot recreate by picking a bigger model.
Social Atlas engine
How residents experience the city, read from what they actually say. Arabic-native sentiment across 20+ dialects, calibrated to the aspect that drove each experience and the emotion behind it — not raw positive-or-negative. 81+ liveability indicators at neighbourhood level, and 84%+ correlation with face-to-face surveys.
Urban Pulse engine
How the city moves. Footfall, visitor flows, dwell times, seasonal patterns. Real-time feeds fused against the same neighbourhood grid as every other layer, so a satisfaction gap in a district and the mobility pattern running through it are always read together.
Urban Spaces engine
How public places actually perform. Computer vision on satellite and street-level imagery detects physical condition. NLP captures how residents describe the space. Machine learning clusters every space in the city into typologies, identifies amenity gaps and generates design recommendations grounded in how the spaces actually behave today.
Watch a cited answer assemble in real time.
The answer assembles in real time, in front of you.
Ask
Type your question in any language. GUS reads it and decides what it is about. Your data, your documents, or both.
Run
The relevant engines run in parallel on your city’s data only. The Social Atlas engine reads feedback, Urban Pulse reads movement, Urban Spaces reads physical condition. Results are scored for relevance and source strength.
Read
A written answer, an embedded map or chart, and follow-up suggestions. Every claim links to its source.
Built for government data. Traceable by default.
What we refuse to compromise on.
Your data stays yours. Every deployment is fully isolated, sitting in its own environment. No sharing, no crossover, no exceptions, no exemptions for us either. A second client’s questions never touch your data, and yours never touches theirs.
Every answer is traceable. Inline citations on every claim. Click one and you see the exact source and the date it was captured. Nothing asserted without a footnote.
And GUS refuses honestly. When the data cannot support an answer, GUS says so directly instead of guessing. Refusal is a feature here.
Prefer a notebook to a dashboard?
Every question you can ask through the UI is also available over a clean REST API. Scoped to your city, rate-limited, documented. Full reference on request.
From kickoff to first decision in eight weeks.
Representative timeline for a city-wide deployment. Faster for single-district engagements or consultancy-led projects. Longer for multi-city rollouts. Subscription, full city-project deployment, or consulting engagement, we scope it to match.
Scope & ingest
We meet your team, catalogue the data you already have, agree on scope. Your data starts flowing in.
Indexed & baselined
Your data is mapped to the neighbourhood grid and baseline satisfaction layers come online. Atlas becomes explorable at draft quality.
Configured for your team
Tools and views enabled per role. Report templates configured for your first use cases. Users onboarded.
First decision
Your team runs its first queries, compiles its first brief, ships its first decision with GUS evidence.
The questions we hear most.
Do you need our data before we can see GUS?
Does GUS hallucinate?
What languages does GUS work in?
Can we self-host?
Bring us a question about your city. We’ll bring the evidence.
Most engagements begin with a two-hour working session around a question your team is already wrestling with. By the end, you’ll see your city inside GUS with your data layered in. Subscription, full city-project deployment, or consulting engagement, we scope it to match.
Contact the GUS team
No gatekeeping, no lead form. You’ll reach the people who’ll actually run the session.