Bring us a question about your city.We’ll bring the evidence.
Clients come to us with six kinds of question. Where economic activity concentrates. How neighbourhoods behave as a system. How the city functions over time. How consumers move through it. How the work compares internationally. And how residents feel about any of it. Every answer draws on the same enriched dataset, the same neighbourhood grid, the same methodology.
What clients ask us, when they need answers.
Urban teams ask very different things of their city. We answer them all from the same source. Each area has its own analytical engine, its own delivery format and its own expert voice. All of them read from the same neighbourhood grid, so findings across areas always agree.
Spatial economics
Where economic activity concentrates and how it is changing. Centres, employment spatialisation, GDP at block level, sector mix per catchment. Built on live activity data alongside official statistics. For teams sizing markets, planning investment or building the economic case for a project.
City behaviour
How the parts of the city link together through movement, footfall and daily rhythm. Activity by hour, flow between districts, mode-split, dwell time. For teams who need to understand how a neighbourhood actually works across 24 hours.
Urban modelling
Understanding how the city functions as a whole. Adaptive urbanism, scenario modelling, function-based catchments, accessibility analysis. For teams testing a policy, a masterplan or an intervention before it breaks ground.
Consumer research
Behavioural insights at the neighbourhood level. Spend patterns, category demand, market-gap analysis, demographic profiles, mobility to and from the area. For operators, retailers and investors who need demand-side evidence.
Development research
Benchmarking a project, a district or a city against the world. Comparable cities, global precedents, best-in-class indicators, peer sets matched by scale and function. For teams who want to know where their work sits internationally.
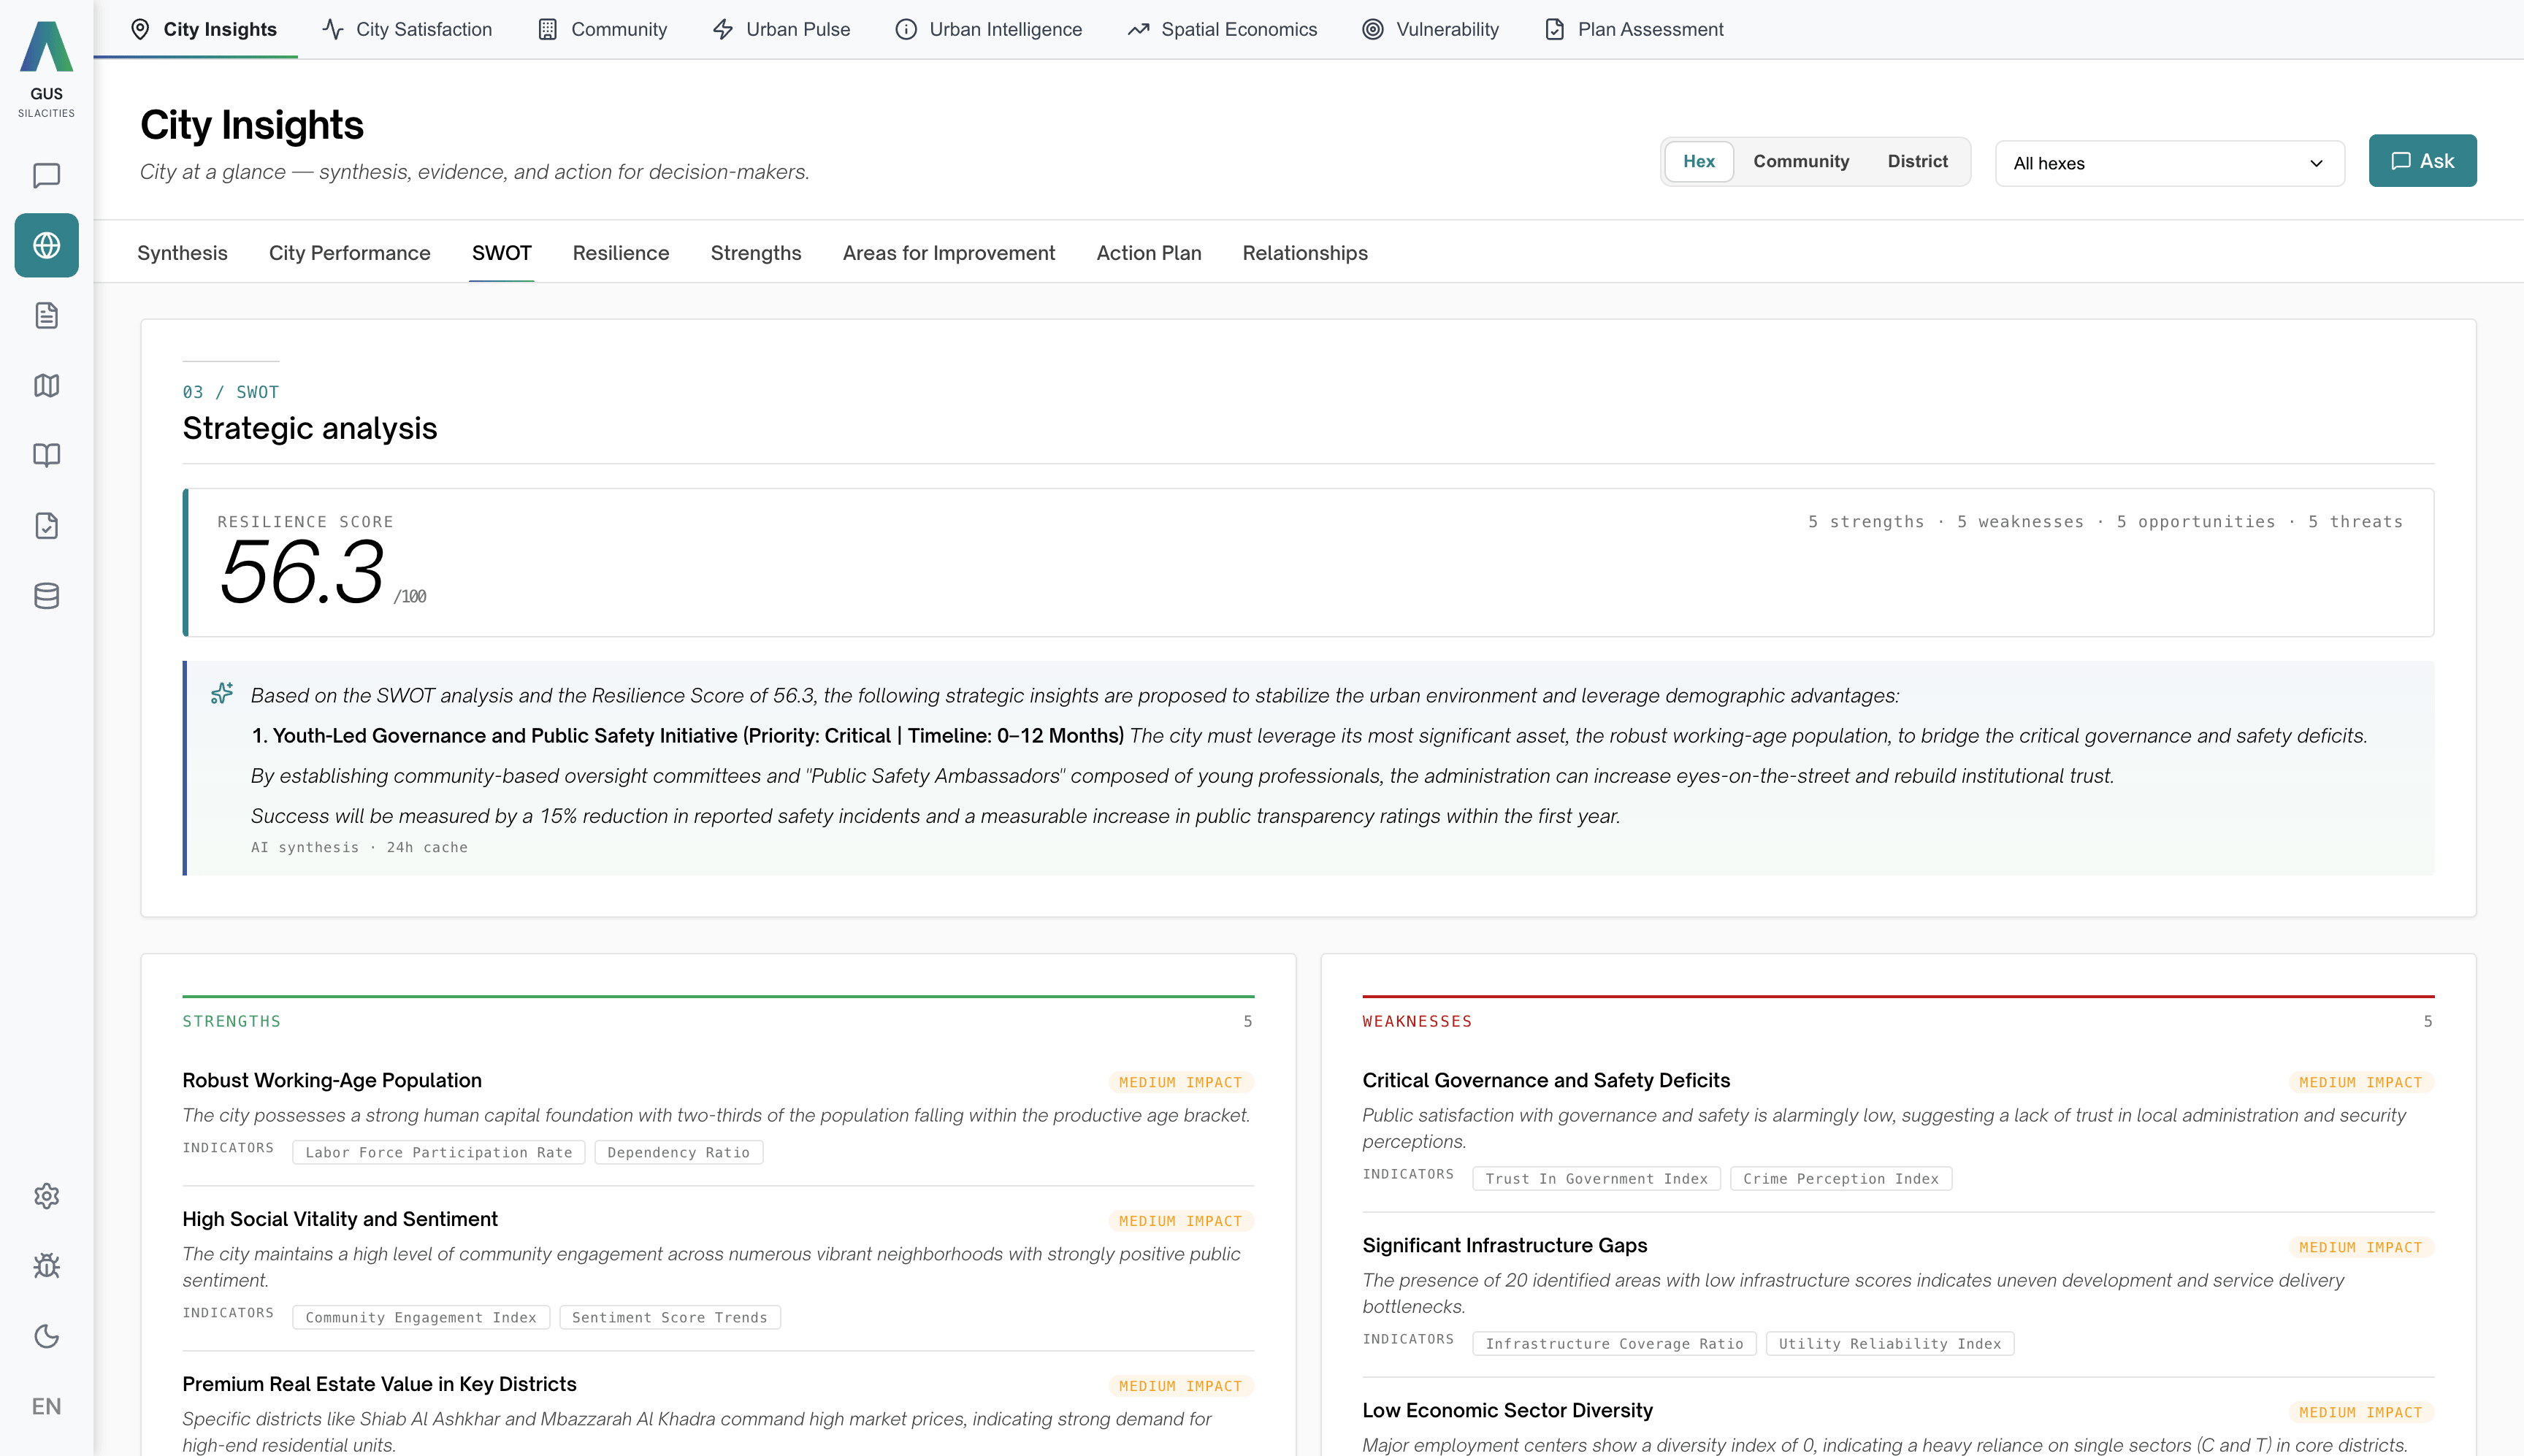
Sentiment and satisfaction
What residents are saying about where they live, and how that varies block by block. Live sentiment across 12 topics and 68 subtopics, scored on the Sila Score (0 to 10), computed by our own NLP models for sentiment and emotion. In any language, with native Arabic across 20+ dialects. One signal among many, weighed alongside the others.
One source of truth the whole team can defend.
First, we connect. Your data, your documents, live signals and our own indicators come onto one enriched dataset, on one neighbourhood grid. Everything a team needs to reason about a city, in one place.
Then insight. Eight expert voices and the AI models behind them read across the connected data and draft cited answers. Planners, economists, urban scientists, behavioural analysts. Each with their own methodology, each writing in their own voice.
Then we measure. Consistent indicators across every area, running critical to excellent on the same scale. So two teams asking the same question of the city get the same answer.
Pick the depth the decision calls for.
Three tiers of analysis, available across every area. Teams pick the depth the decision in front of them calls for.
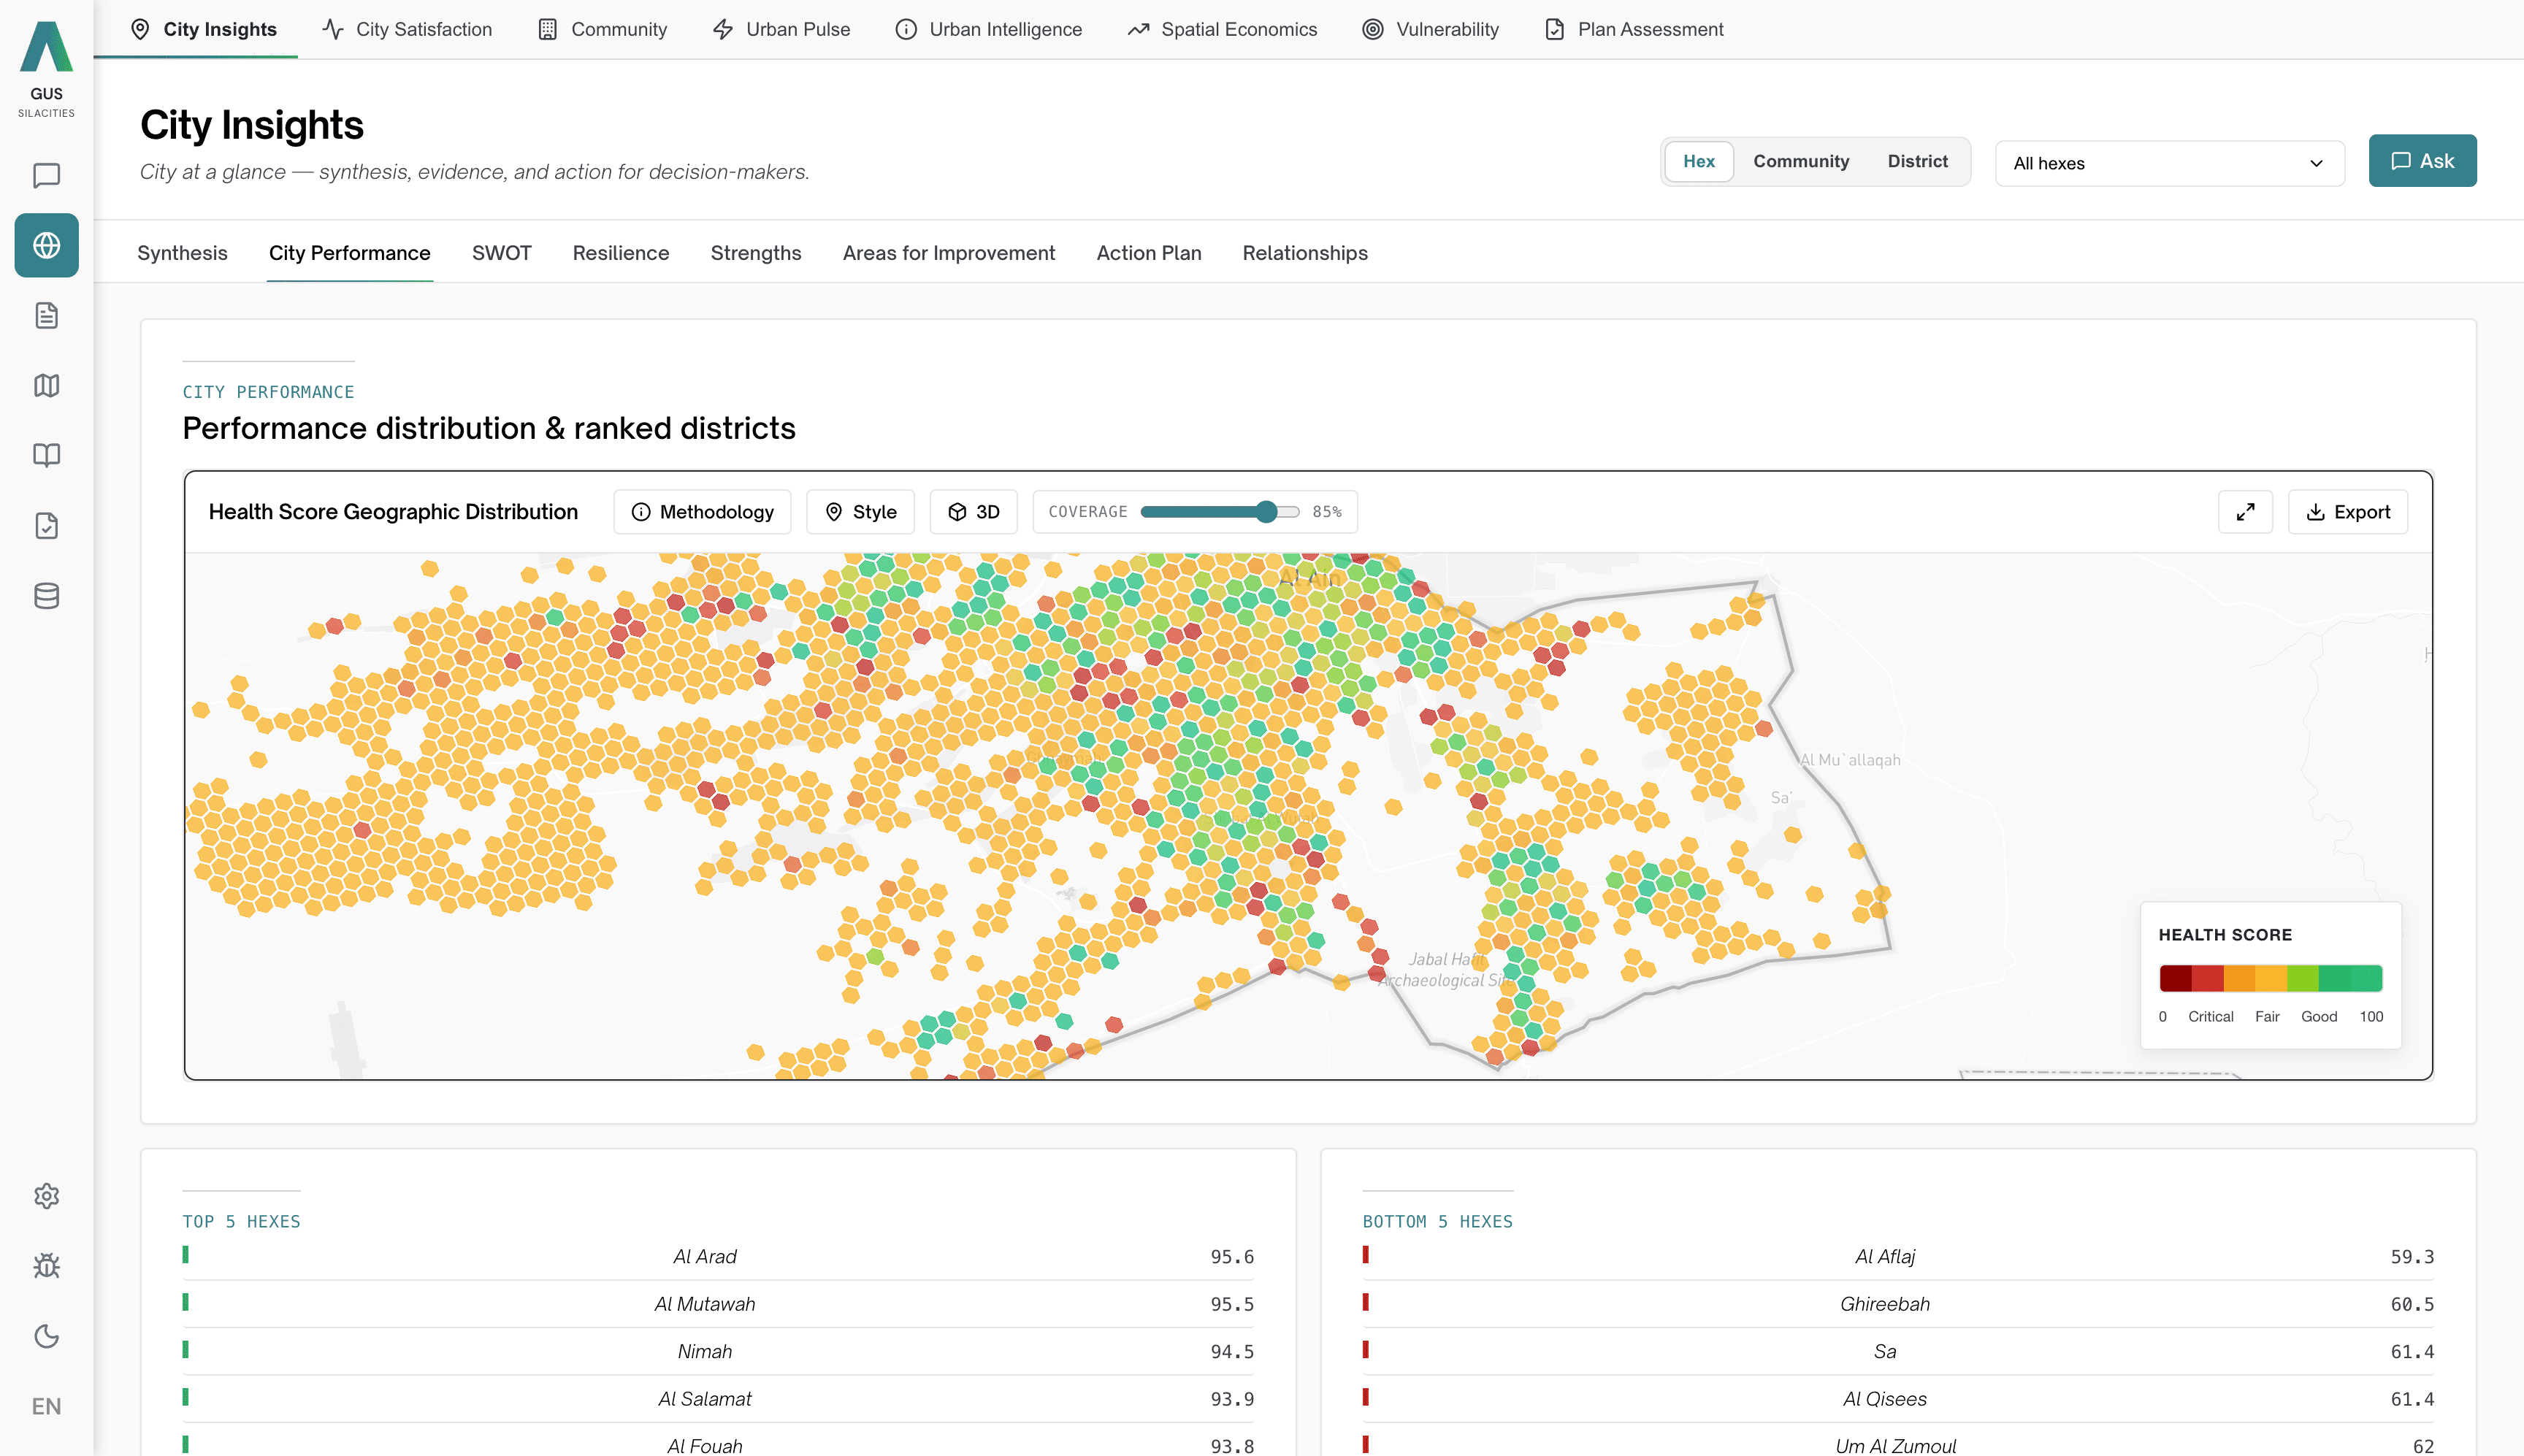
Descriptive
What is happening, where, and how it is changing. The baseline view any decision starts from. Maps, charts, annotated briefs, all cited.
Predictive
What the signals suggest will happen next. Trend modelling, scenario testing, forecast ranges with confidence intervals. For teams planning ahead.
Evaluative
How a policy, project or intervention is performing against its goals. Before and after analysis, benchmarking, cited conclusions. For teams measuring the impact of the work.
Subscription, deployment, consulting. Scoped to match.
Every analytical area is available through any of the three. Most engagements begin with a two-hour working session around a question your team is already wrestling with.
Subscription
GUS as an ongoing platform for your team. Continuous data updates, onboarding in weeks, support from the people who built the tool. For teams who want the evidence layer always on.
City-project deployment
A full deployment for a city, a region or a major development. Your data, your documents, your own instance. Representative timeline: eight weeks from kickoff to first decision on GUS evidence.
Consulting engagement
A scoped project with our analyst team. We run the analysis, you get the brief. For one-off studies, regulatory submissions, or questions that sit outside the platform’s current reach.
The questions we hear most.
Do we have to use the platform to work with you?
Can we commission just one of the six areas?
How long does a consulting engagement take?
Who sits on the engagement?
Bring us a question about your city. We’ll bring the evidence.
Most engagements begin with a two-hour working session. By the end you will see the question answered inside GUS, with your own data layered in. Subscription, full deployment or consulting engagement, we scope it to match.
Contact the services team
No gatekeeping, no lead form. You will reach the people who will actually run the session.