Find out how people actually live in your city.Planning, for people.
Atlas is where most of the day's work happens inside GUS. Seven tabs, each a different lens on how people actually live in your city, all on the same neighbourhood grid: Synthesis, City Satisfaction, Community, Urban Pulse, Urban Intelligence, Spatial Economics, Vulnerability. Pick a tab, frame an area, read what's there. The ✦ Ask dock travels with you across every tab and replies in plain language with cited evidence.
From "open Atlas" to "this is the district" in a few clicks.
Pick a tab, scope the area, filter the metric, ask the assistant.
Pick a tab
Synthesis · City Satisfaction · Community · Urban Pulse · Urban Intelligence · Spatial Economics · Vulnerability.
Scope the area
Switch the scale picker between Hex, Community or District. Multi-select specific districts or communities with the unit picker. The map, KPI cards and charts update without an Apply button.
Filter
Narrow by topic, year, demographic segment or sector. Filters and scope carry across every tab, so a question you start in Satisfaction picks up where you left off in Community.
Ask
Open the ✦ Ask dock from the scope bar. It reads the same layers you are looking at, replies with inline citations, and toggles between "this view" and "broader" against the full city dataset.
See how people actually live in your city.
Each lens runs its own analysis against the same fused dataset on the same neighbourhood grid. Pick a lens — the screenshot, the read, and the key figures change with it. The ✦ Ask dock follows you across every one.
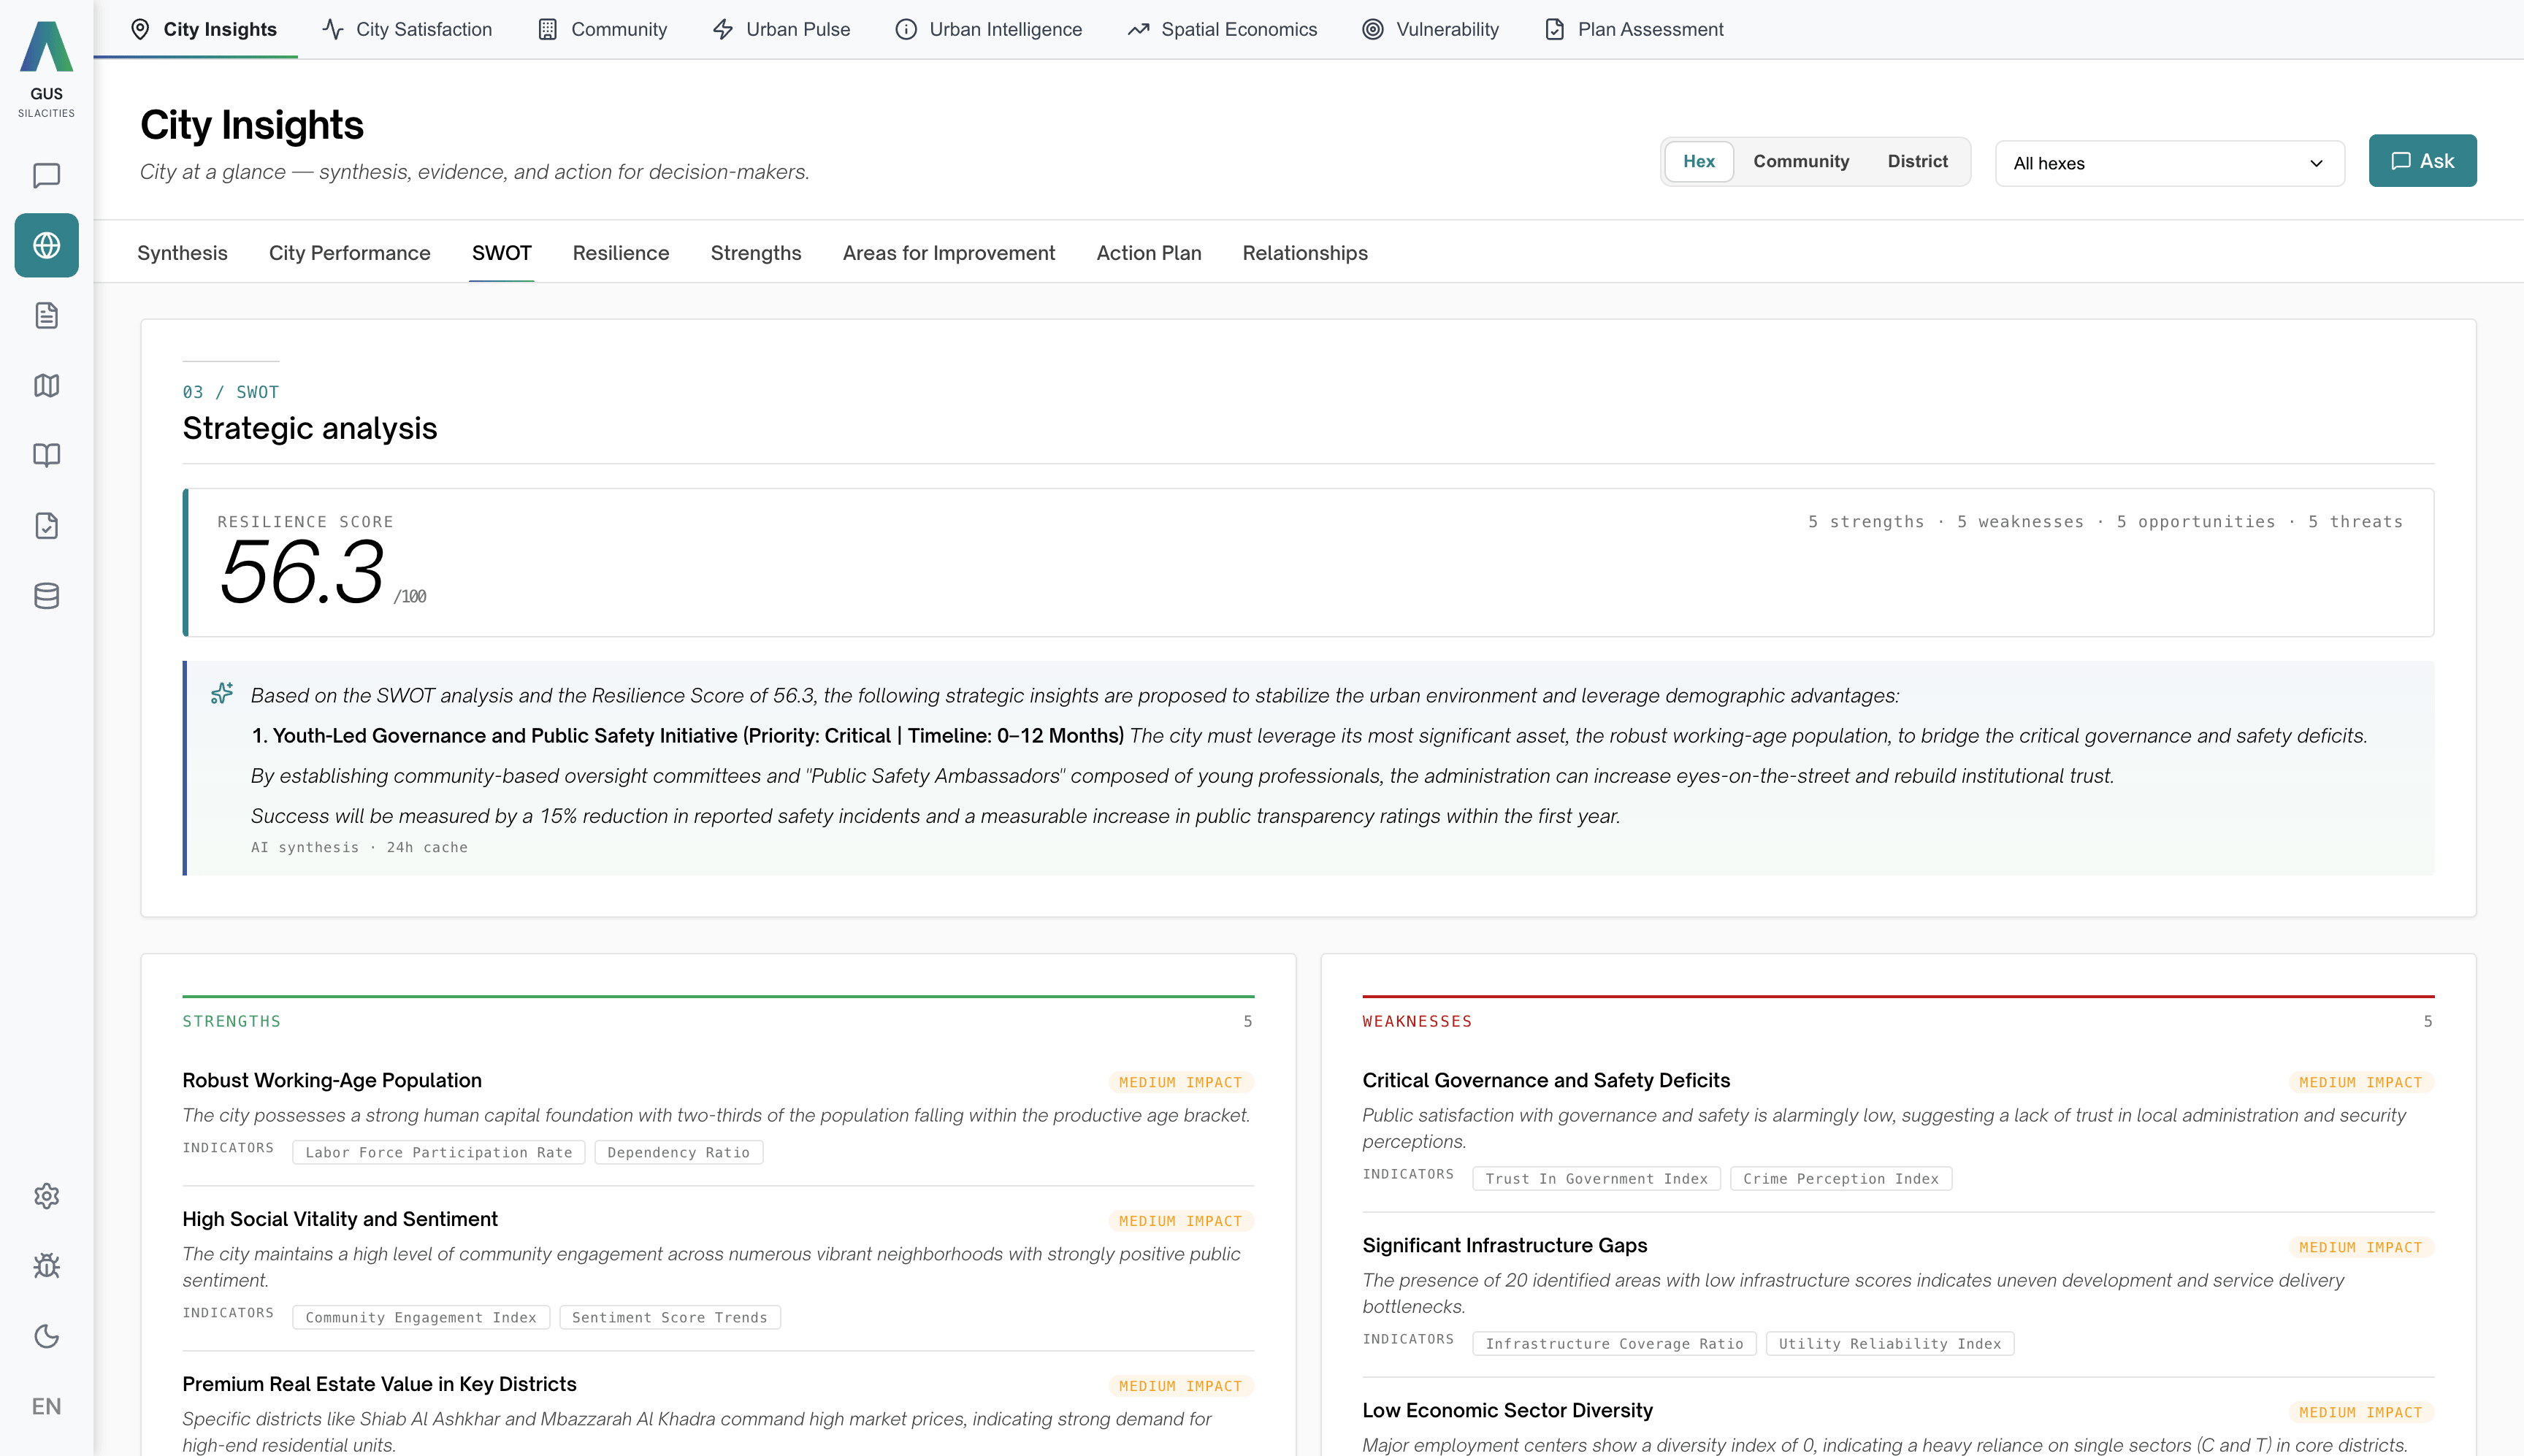
Atlas · Synthesis · health + SWOTSynthesis
The overall read on the city. Health score, SWOT, strengths and weaknesses, resilience, areas for improvement, relationships and an AI synthesis. The lens to open first.
Sentiment, behaviour and place — read together.
Social Atlas engine
Powers · City Satisfaction · Vulnerability
Urban Pulse engine
Powers · Urban Pulse
Urban Spaces engine
Powers · Urban Intelligence
What Atlas does that a BI tool cannot.
7 lenses on your city
From Synthesis to the AI assistant. You turn lenses on and off per deployment. Your team sees only what they need.
One shared scale
The Sila Score runs critical to excellent across every topic. One legend, every view.
Time-aware
Every layer knows its date. Pivot any view by year, month or season to see the direction of travel on every indicator.
Drill into any area
Click any neighbourhood for a full profile across every enabled view. Satisfaction, demographics, activity, all on one screen.
AI Assistant, built in
Ask Atlas in plain language. The same conversation thread follows you across every view, reading the layers you have open and replying with the same citations.
Compare districts
Put any two districts side by side across every metric in the view. Surface the gap instantly.
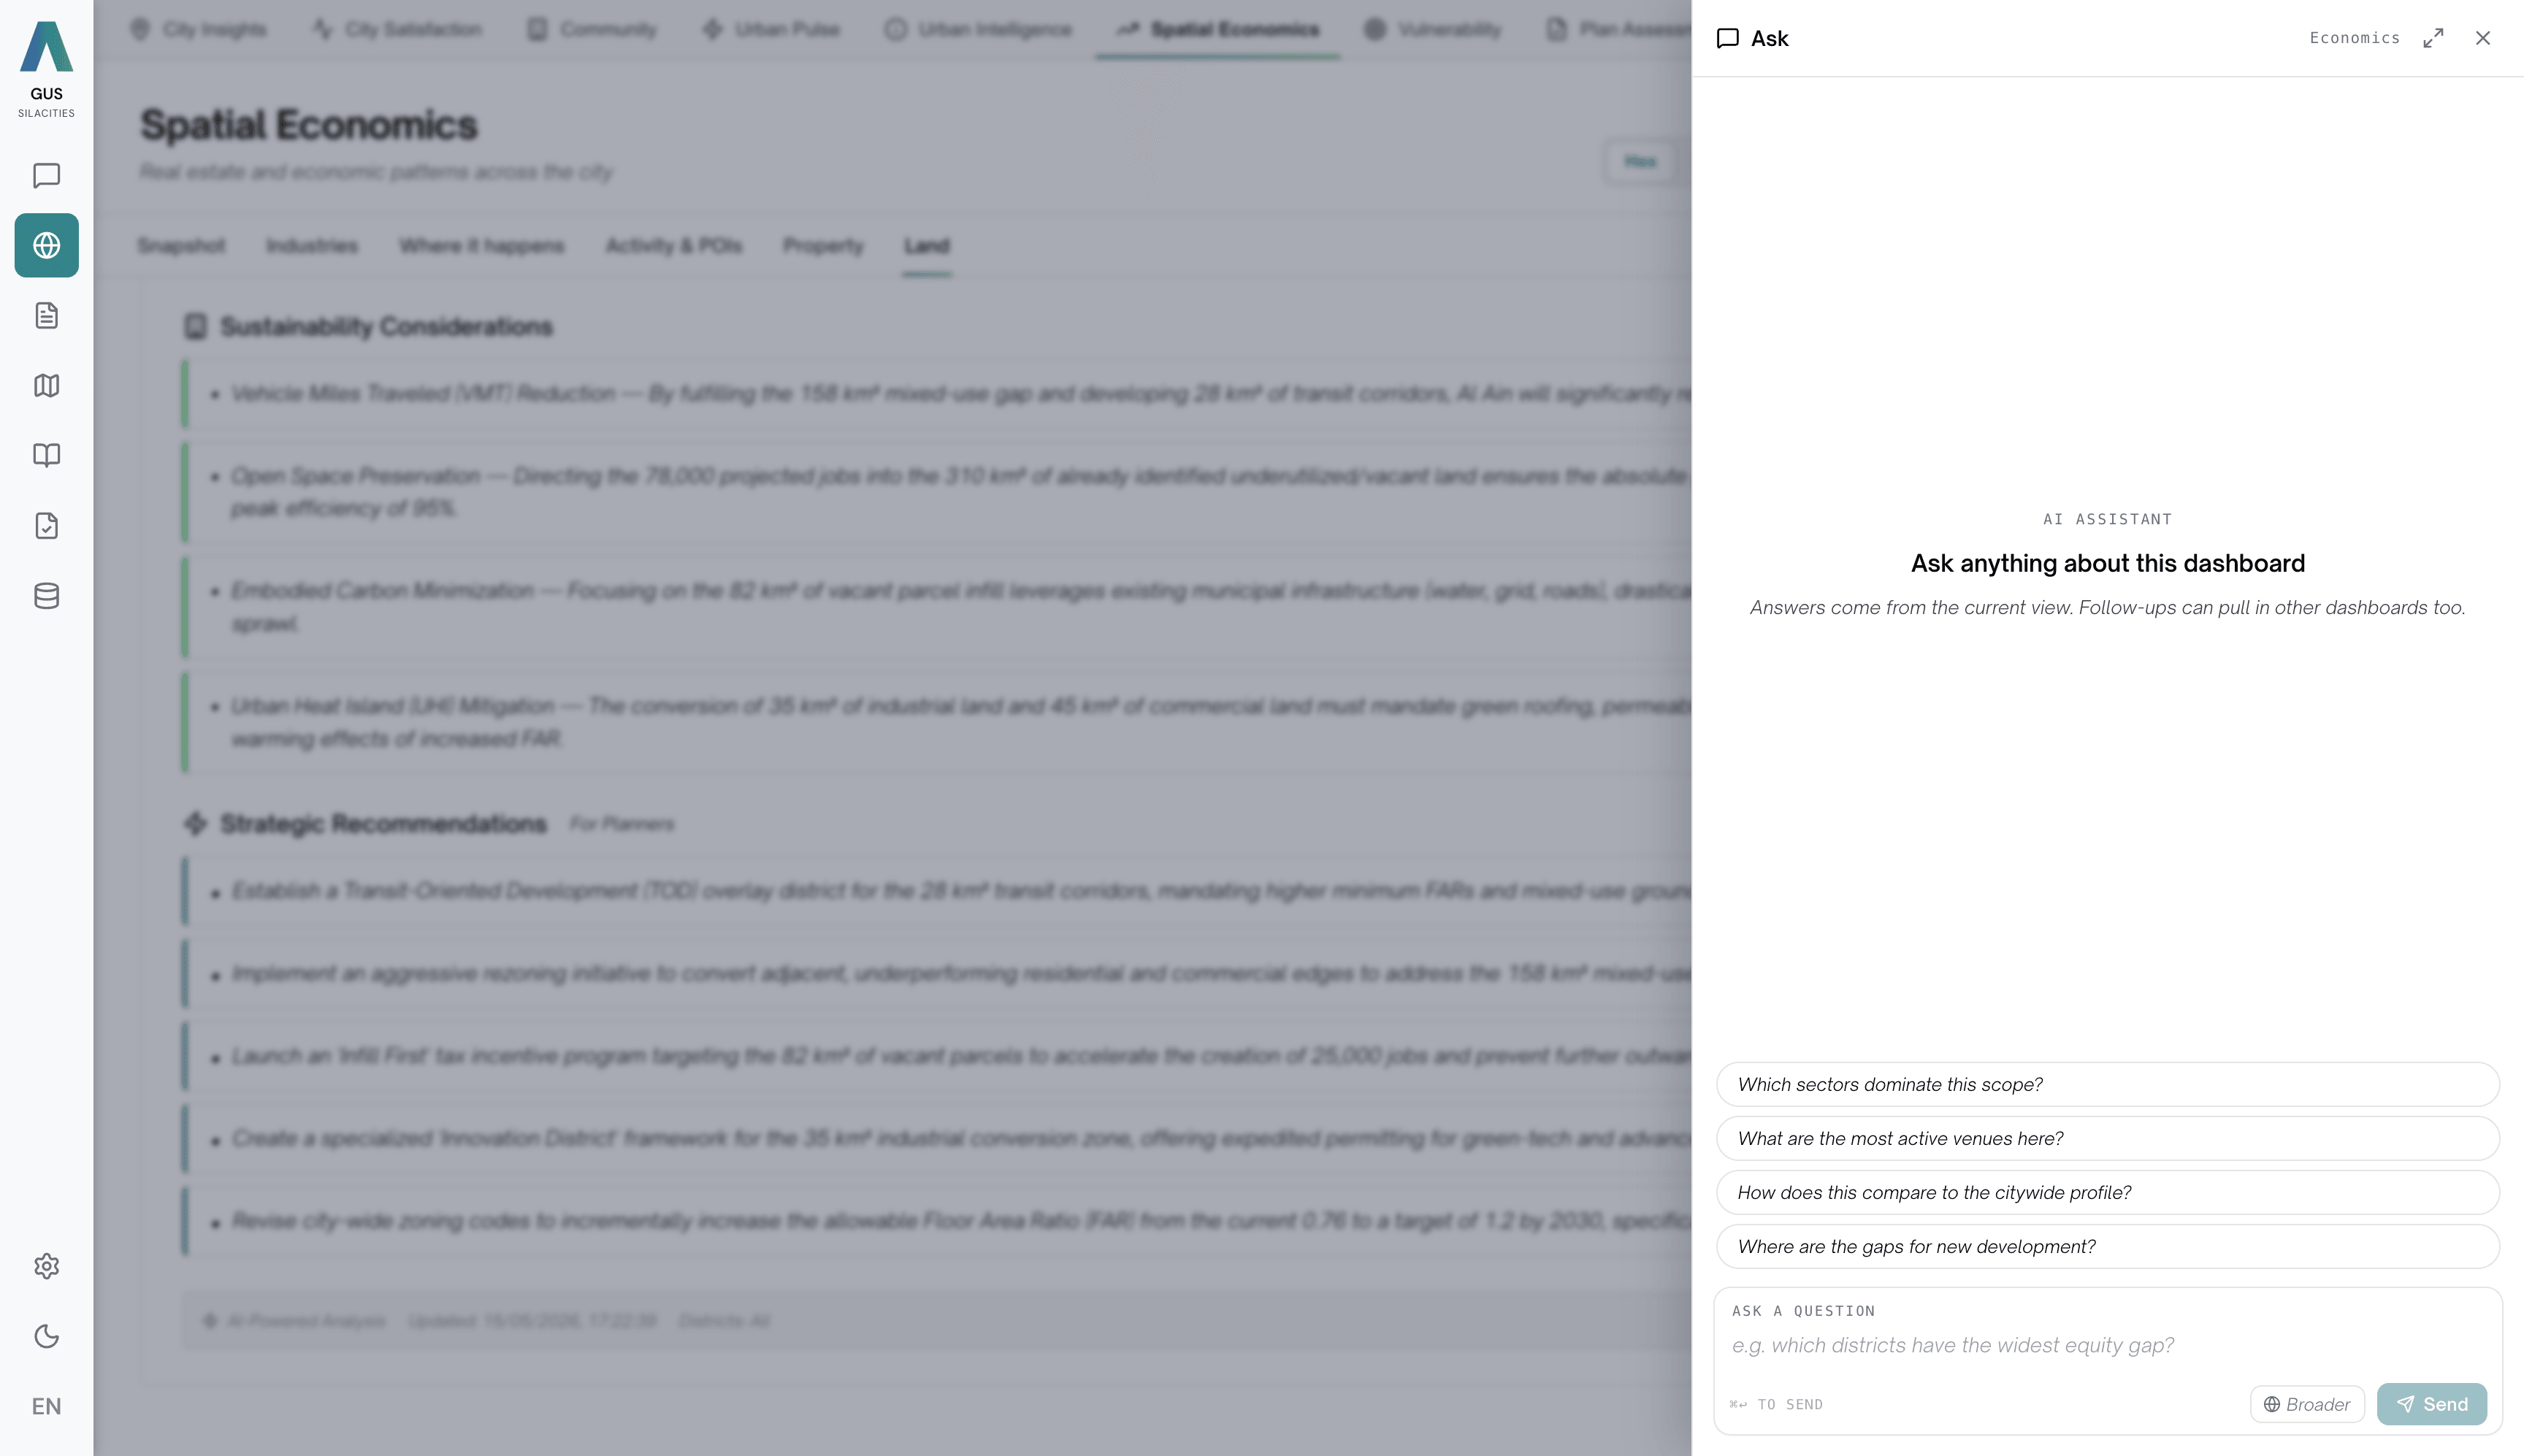
One assistant, every lens.
The ✦ Ask dock travels with you across all seven lenses. It reads the layers you are looking at, picks up your scope and filters, and replies in plain language with inline citations — toggling between "this view" and "broader" against the full city dataset.
Eleven weeks of neighbourhood diagnosis compressed into a working morning. For the first time, our council and spatial team saw the same evidence on the same screen, cited to the same row.